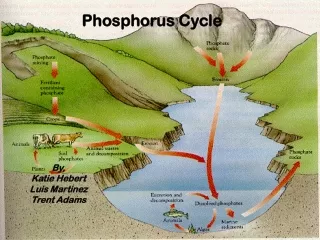
Phosphorus Measurements
Phosphorus Measurements. The Technique Detection Limits Wallastonite. Ascorbic Acid Technique. Ammonium molybdate and antimony potassium tartrate react in an acid medium with orthophosphate -phosphorus to form an antimony-phospho-molybdate complex.

Phosphorus Measurements
E N D
Presentation Transcript
Phosphorus Measurements • The Technique • Detection Limits • Wallastonite
Ascorbic Acid Technique • Ammonium molybdate and antimony potassium tartrate react in an acid medium with orthophosphate-phosphorus to form an antimony-phospho-molybdate complex. • This complex is reduced to an intensely blue-colored complex by ascorbic acid. • The reaction is slow and the complex is not stable and thus analysis must be performed after 10 minutes and before 30 minutes.
Interference • Barium, lead, and silver interfere by forming a precipitate. • The interference from silica, which forms a pale-blue complex is small and can usually be considered negligible. • Arsenate is determined similarly to phosphorus and should be considered when present in concentrations higher than phosphorus.
Sample Preparation • No pretreatment • Measures orthophosphates • Sulfuric acid treatment • Measures hydrolyzable and orthophosphates • Persulfate digestion (strong oxidant) • All phosphorus converted to orthophosphates • Measures total phosphorus
Detection Limits • What controls our ability to measure small concentrations of phosphorus? • How could we determine if the answer we get is meaningful? • Expected analytical range is 10 mg/L to 1 mg/L as phosphorus
Types of Detection Limits • Instrument detection limit (IDL) • instrument noise • Method detection limit (MDL) • instrument noise • sample preparation • Practical quantitation limit (PQL) • routinely achievable detection limit with reasonable assurance that any reported value greater than the PQL is reliable • 5 times MDL Which dominates?
Instrument Noise for a Spectrophotometer • What measurements are involved in obtaining a concentration reading from a spectrophotometer? • _____________ • _____________ • _________________________________ • _________________________________ • _____________ • _____________ Reference (P0) Lamp intensity Absorbance of reference solution Absorbance of cuvette Standards sample preparation Sample
What are the limitations at low concentrations? • Po - _________ light intensity • P light intensity after passing through sample • As C 0 P __ • Describe the journey after light leaves sample to computer • ______________________________________ • ___________________ • ________________________________ Reference P0 Photons strike diode and produce a voltage response Voltage is digitized Digital Calculations → absorbance
Minimum Detectable Absorbance • Suppose a 12 bit Analog to Digital Converter is used. What is the smallest absorbance that can be measured? 12 bit ( ) means _____ intervals 4096 What if P0 is digitized into 200 intervals?
Additional Instrument Limitations • Differences in ___________ • Fluctuations in ______ intensity • Power supply • Warm up time • Repeatability of Cuvette ___________ • Sample carryover if using sipper cell Cuvettes Lamp alignment
Method Detection Limit • "Method detection limit" is the smallest concentration that can be detected above the noise in a procedure and within a stated confidence level. • What is C such that I can be 99% confident that C > 0?
Measuring the MDL • Make a standard that is near the MDL • Divide it into at least 7 portions. • Process each portions through all sample preparation and analysis steps • Calculate the MDL using the equation n is the sample size, s is the standard deviation, a=0.01 is generally the required confidence, t is the student t distribution
Is the MDL > IDL? • Are sample preparation errors significant? • Variability in reagent blank (reference sample) • Results in a calibration curve with nonzero intercept • Sample contamination • Ultra pure water • Acid washed plastic or glass ware • Airborne contamination
Decreasing the IDL • May or may not decrease the MDL • How can you improve an estimate of a parameter? • Use more ________! • How could you use a section of the spectrum? • Use standards to determine _________ ________ ______ • Take an average of all the predicted concentrations? diodes Arrays! extinction coefficient array
Maximum Detection Limit • Chemistry • reagent limitations (stoichiometry) • reaction by-products • Instrument limitations • Maximum detection limits are easily surmounted by __________ dilution
Wallastonite • Wallastonite (calcium metasilicate mixed with ferrous and aluminum metasilicate) tailings can be used to effectively remove phosphorus from solution. • These tailings are waste products generated during wallastonite ore mining in Northern New York.
Wallastonite Column Results 5 mg phosphorus/L influent • Why are long retention times needed? • What is the mechanism?
Wallastonite Research (Proposal) • Quantify phosphorus removal as a function of time in batch tests • Phosphorus concentration (100 mg/L) • Wallastonite concentrations (0, 10, 30, 100, 300, 1000) mg per 7 mL phosphorus solution • Batch contact times (1, 5, 15, 30, 60, 90) minutes
Prelab • You will be creating 1 mL standards by diluting a stock of 100 mg P/L (1, 3, 10, 30, 100 mg P/L) • Reagent dilution problem
Spectral Analysis • The initial extinction coefficient arrays are obtained from the slope of the linear regression line for A(l) = f(c) • Uses general least squares regression to add multiples of extinction coefficient arrays for each component to obtain the best curve fit for the sample • A better estimate of the extinction coefficient is obtained by interpolating between adjacent standards • Repeat least squares regression analysis