Download
1 / 1
10 likes | 163 Vues
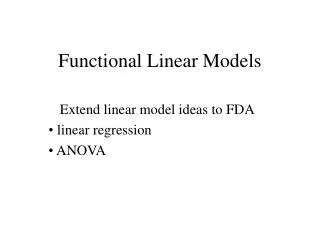
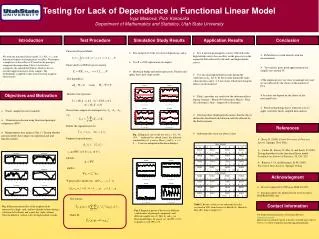
Testing for Lack of Dependence in Functional Linear Model Inga Maslova, Piotr Kokoszka Department of Mathematics and Statistics, Utah State University. Size and power of the test do not depend on p and q . Use R = 1000 replications of samples

E N D
Testing for Lack of Dependence in Functional Linear Model Inga Maslova, Piotr Kokoszka Department of Mathematics and Statistics, Utah State University • Size and power of the test do not depend on p and q. • Use R = 1000 replications of samples • Brownian bridge and motion processes, Fourier and spline bases give same results Equivalently, in Hilbert space notation Test hypothesis: versus Introduce the operators: Denote their empirical counterparts by e.g. Define the eigenelements by Fig. 2 Empirical size of the test for α = 1%, 5%, 10% (indicated by dotted lines) for different combinations of p and q. Here εn and Yn, n = 1, 2,…, N are two independent Brownian Bridges. Empirical eigenelements: Identity implies Ψ practically vanishes on if Test statistic: Fig. 3 Empirical power of the test for different combinations of principal components and different sample sizes N. Here Xn and εn are Brownian Bridges. In panels (a), (b) ||Ψ|| = 0.75; in panels (c), (d) ||Ψ|| = 0.5. Under H0 Introduction Test Procedure Simulation Study Results Application Results Conclusion Functional Linear Model: • Test if auroral geomagnetic activity reflected in the high-latitude curves has an effect on the processes in the equatorial belt reflected by the mid- and high-latitude curves • Use one-day high-latitude records during the substorms as Xn. Let Yn be the records during the same substorm days and 1, 2, 3 days later. Check how long the effects of substorm last • Table 1 provides test results for the substorm effects during: January – March (40 substorms); March – May (42 substorms); June – August (42 substorms) • Selecting three month periods ensures that the data is identically distributed (distribution could be effected by the Earth rotation) • Substorm effect lasts for about 2 days • FLM allows to work directly with the measurements • Test statistic gives good approximation for sample sizes around 50 • The empirical sizes are close to nominal sizes and are not affected by the choise of the number of PC’s • Test does not depend on the choise of the functional basis • Novel methodology that is relatively easy to apply, useful for finely sampled data analysis We study the functional linear model, Yn= ΨXn + εn, with functional response and explanatory variables. We propose a simple test of the nullity of Ψ based on the principal component decomposition. The test statistic has asymptotic chi-squared distribution, which is also an excellent approximation in finite samples. The methodology is applied to data from terrestrial magnetic observatories. Objectives and Motivation • Finely sampled records available • Dimension reduction using functional principal components (FPC) • Magnetometer data analysis (Fig. 1). Testing whether auroral currents have impact on equatorial and mid-latitude currents References • Bosq, D. (2000). Linear Processes in Function Spaces. Springer, New York. • Cardot, H., Ferraty, F., Mas, A. and Sarda, P. (2003). Testing hypothesis in the functional linear model. Scandinavian Journal of Statistics, 30, 241- 255. • Ramsay, J. O. and Silverman, B. W. (2005). Functional Data Analysis. Springer Verlag. Acknowlegment • Research supported by NSF grant DMS-0413653. • Data provided by the global network of observatories – INTERMAGNET data Contact Information Table 1. Results of the test for substorm days that occurred in 2001 from January to March (A), March to May (B), June to August (C). Fig. 1 Horizontal intensities of the magnetic field measured at a high-, mid- and low-latitude stations during a substorm (left column) and a quiet day (right column). Note the different vertical scales for high-latitude records. For further information please contact Inga Maslova (Inga@cc.usu.edu). Manuscript on which the poster is based is available upon request. Poster is available at http://cc.usu.edu/~inga/research.htm.