Download
1 / 68
690 likes | 773 Vues
Stationary orographic cloud bands : Dynamic and sportive interests link satellite observations with mesoscale modeling. science aspects user & application aspects. Hans Volkert DLR, Institut für Physik der Atmosphäre (IPA), Oberpfaffenhofen, DE. Outline

E N D
Stationaryorographiccloudbands:Dynamicandsportiveinterests link satelliteobservationswithmesoscalemodeling scienceaspects user & applicationaspects Hans Volkert DLR, Institut für Physik der Atmosphäre (IPA), Oberpfaffenhofen, DE Outline - 1 Feb 2014 casewithcloudsasvisualizationaid • decade-oldproblemrevisitedby modern means • conclusionsforscience/userrelation? in memoriam: Joachim KUETTNER 1909-2011 Science directorof GATE, ALPEX &c. (cf. SCI-POS 1085)
1 Feb 2014: MODIS (7-2-1) on TERRA, 10:27 UT 500 hPa, 12 UT PL 20 m/s 500 km 750 km CZ DE FR 20 km AT Inversion at 600 hPa ~ 4.2 km CH
1 Feb 2014: MODIS (7-2-1) on AQUA, 12:12 UT pxres. 250 m JelenicaGora (Hirschberg) Innsbruck
1 Feb 2014: MODIS (7-2-1) on TERRA, 10:27 UT
1 Feb 2014: MODIS (7-2-1) on AQUA, 12:12 UT
1 Feb 2014: SEVIRI on Meteosat Second Generation Poor man‘s loop: 8 frames at 15‘ intervals 10:30 – 12:15 UT Variable speedloop: 37 frames at 15‘ intervals 07:00 – 16:00 UT on mylaptop at posterSCI-POS1085 in room220D-E Hres VIS pxres 1 km
SEVIRI on MSG 10:30 UT
SEVIRI on MSG 10:45 UT
SEVIRI on MSG 11:00 UT
SEVIRI on MSG 11:15 UT
SEVIRI on MSG 11:30 UT
SEVIRI on MSG 11:45 UT
SEVIRI on MSG 12:00 UT
SEVIRI on MSG 12:15 UT
SEVIRI on MSG Sudety mtns A L P S So what ? Describedbefore ? 12:15 UT
Short revisitof an 75-year-old publicationof 36 pp. oneof35photogrpaphs
21 May 1937 – vertical velocity in lee of Riesengebirge – + – + – + ~ 8 km oneof11 diagrammes 20 m/s
waves & rotorsbehindRiesengebirge, 21 May 1937 regional gliding competition with 22 workable barogrammes
gliding on 1 Feb. 2014 Wojciech MAJEWSKI (PL) 1 h 54‘ to max. 5830 m AGL Andrzej ŻUK(PL) 3 h 06‘ to max. 3900 m AGL www.onlinecontest.org/olc-2.0/gliding/flightinfo.html?dsId=3470203 www.onlinecontest.org/olc-2.0/gliding/flightinfo.html?dsId=3469671
Whataboutmesoscalemodelling ? • verticalvelocitycalculatedfor 1 Feb 2014 case • referenceto MAP study
Realisticsimulation: w in z=5000 m (m/s) 52° 50° 12° 15° Meso-NH: 12 h simulation, VT = 12 UT, Dx = 2 km courtesyof Evelyne RICHARD
cf. MAP caseover Eastern Alps: IOP10, 25 Oct. 1999 Meso-NH simulation Dx = 2 km
Concludingremarks Sports peopleandscientistscanshareinterest Someissuesarearoundfordecades New technologiescanmakethingseasier Stationaritydocumentedratherthanassumed Clouds heremarkersratherthanactors Can gliderdatabeusedmoreasresearchdatasets? Mountains wavecasesmaybeusedastestbedfor high-resolution mesoscalemodelling
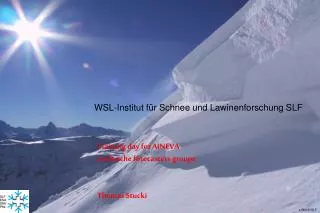
Bonus material - Webcam imagesfromPatscherkofel - southof Innsbruck facingnorth - on 1 Feb 2014 - 06:12 to 16:52 UT (43 framesduring MSG period)