Download

1 / 35
350 likes | 465 Vues
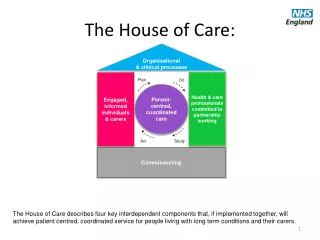
You Bet We Still Care!. The “A” Word Conference, Ryerson University March 1, 2013. Types of questions employee survey . Work experience and current job. Recruitment and retention. Personal information. Education. Job Satisfaction and future plans.

E N D
You Bet We Still Care! The “A” Word Conference, Ryerson University March 1, 2013
Types of questions employee survey Work experience and current job Recruitment and retention Personal information Education Job Satisfaction and future plans PD and professional association membership Wages and working conditions Facilities, spaces and children
Types of questions employer survey Employee questions for centre directors Staffing Spaces and enrolment Recruitment and retention HR management and planning Governance and facilities Finances Personal information
How Many Responded to the Surveys? • Program staff: 2,344 • Centre directors: 1,427 . • Total responses to employer survey: 1,145 • Total responses to employee survey: 3,480 Recruitment questions: • Administrators and owners not working in the programs: 437 • Centre directors from both surveys: 1,427
42% of centres operated by an organization with more than one centre Are the results representative? Not structured to be a representative sample, but type of returns generally reflect nature of programs across the country and within PTs 54.5% operated programs in addition to full-day child care 73% non-profit and public; 26% commercial 77.4% of employers in urban centres, 19.3 % in rural centres • 2.7% First Nations, Metis, Inuit governing body; 2.1% municipally operated
Program Staff: Quick Facts More than 98% female – median age: 38 years First language: 82% English, 6% French, 12% other Median years in the sector: 12; in current position: 3 Median hours work/week: 37 Participated in PD in past 12 months: 88.5% Worked in a unionized centre: 21.5% Worked at second job: 25% Belonged to a child care organization: 52.5%
Program Staff: Post-secondary Early Childhood Education 90% have some post-secondary ECE 75% college credential 65% two-year diploma or higher 10% one-year certificate 11% university degree 4% have some other form of ECE credential
Centre directors: quick facts 97.8% female – median age: 45 years First language: 78% English, 13.2% French, 8.9 % other More than 15 years in the sector: 62.9%; median years in current position: 6 Median hours work/week: 40 Participated in PD in past 12 months: 90.6% Worked at second job: 18.5% Belonged to a child care organization: 73%
Centre directors: Post-secondary Early Childhood Education 90% have some post-secondary ECE 66% college credential 55% two-year diploma or higher 11% one-year certificate 20% university degree 4% have some other form of ECE credential
Centre Directors 27.2% are counted in ratio all of the time 47.6% are counted in ratio part of the time 25.1% are never included in the ratio
Education makes a difference to staff wages MEDIAN HOURLY WAGES: • $13.00 with no post-secondary ECE • $16.88 with an ECE certificate or diploma • $17.20 with an ECE-related degree
Unionization makes a difference to staff wages and benefits MEDIAN HOURLY WAGES ARE HIGHER: $20.11 for program staff $25.55 for directors in a unionized centre Unionized staff are more than twice as likely to have more than three benefits (70.4% vs. 33%) than non-unionized staff
Working in ratio makes a difference to directors’ wages MEDIAN HOURLY WAGES, IN THE RATIO: • All of the time: $19.49 • Some of the time: $22.00 • None of the time: $25.86
Staff working in centres with selected personnel policies Written job description: 71.1% Policy/procedure manual: 83.3% Regular written performance appraisal: 51.1% None of the above: 4.4%
Parent fees NL: infant fees not reported due to small number of infant programs in that province
Percent of employers with the following recruitment challenges
Will you still be in this job in three years? YES! • 75% of program staff • 82.4% of centre directors
Plans for program staff intending to be working in regulated child care in three years
Plans for program staff intending to leave regulated child care in three next three years
Multi-site programs Multi-site operations ranged from 2-91 centres Non-profit organizations were more likely to hold multiple licenses than commercial operators (33% compared to 21%) Median wages in multi-site and single-site programs were similar except in SK and AB where they were higher • 29% of multi-site employers expect to expand in next three years
Wages generally up; loss of benefits for some Overall job satisfaction good Recruitment challenges significant for some employers Moving to the school system issue for Ontario Growth in operators with multiple licenses Increase in percentage with post-secondary ECE Better? Worse? Trends?
Future research is needed - You Bet We Still Care! includes recommendations about: • Future research and analysis that may be addressed by the current data set: • Future methodological approaches to conduct this type of research in the ECEC sector • The need for ongoing, systematic data collection about the child care workforce
What now? • Prepare data set for public use and make • available through the Institute for Social Research at York University: http://www.isr.yorku.ca/contact/index.html • Consider the implications of the findings and how to use them • Further research and analysis in future if funds available