Friday 3/7
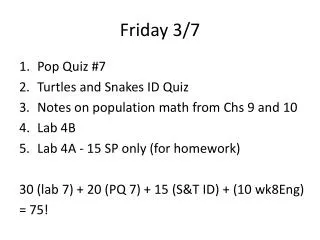
Friday 3/7. Pop Quiz #7 Turtles and Snakes ID Quiz Notes on population math from Chs 9 and 10 Lab 4B Lab 4A - 15 SP only (for homework) 30 (lab 7) + 20 (PQ 7) + 15 (S&T ID) + (10 wk8Eng) = 75!. Pop Quiz #7. Snakes begins on next slide. 1. 2. 3. 4. 5. 6. 7. 8. 9. 10.

Friday 3/7
E N D
Presentation Transcript
Friday 3/7 • Pop Quiz #7 • Turtles and Snakes ID Quiz • Notes on population math from Chs 9 and 10 • Lab 4B • Lab 4A - 15 SP only (for homework) 30 (lab 7) + 20 (PQ 7) + 15 (S&T ID) + (10 wk8Eng) = 75!
We’ve talked about (at least) one way to determine if a population is growing • ?
Rate? • Variable per time
Rate? • Variable per time • N, t N/t = rate • Individuals added per unit time = rate of growth
BUT, • The growth rate will change in response to other variables • Like what?
So, Change in Rate dN/dt
So, Change in Rate dN/dt = rN
This is compounding dN/dt= rN Because as N gets larger, the constant r multiples by a larger and larger number. As population size (N) increases, the rate of increase gets larger. The result of this compounding is an exponential growth curve. (p 243, 244, 245 Molles; p 67 Kingsolver for examples)
PS - Stretch it out • By plotting this same data on a logarithmic scale (10X at each increase), the line straightens out (p 68 Kingsolver)
In exponential growth • We can determine the population size at any time (t), by: Nt = N0ert
Can exponential growth continue forever? • Stay tuned for logarithmic (more realistic) growth models (11.2 – 11.3)
For Monday • Read Molles 11.2 and 11.3 • Finish AA sheep • Monday is last day to withdraw from full semester courses • Exam 2 is M 3/31 – Ch 9-12 • Five labs left – all field