Download
1 / 44
440 likes | 539 Vues
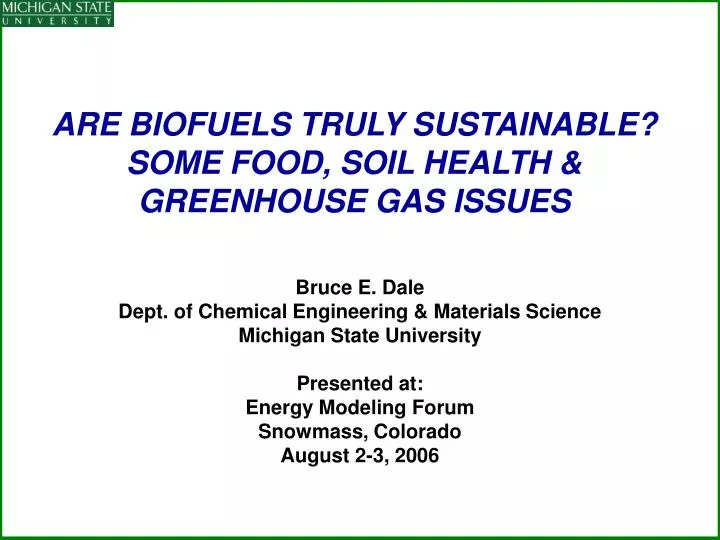
ARE BIOFUELS TRULY SUSTAINABLE? SOME FOOD, SOIL HEALTH & GREENHOUSE GAS ISSUES. Bruce E. Dale Dept. of Chemical Engineering & Materials Science Michigan State University Presented at: Energy Modeling Forum Snowmass, Colorado August 2-3, 2006. Presentation Overview.

E N D
ARE BIOFUELS TRULY SUSTAINABLE?SOME FOOD, SOIL HEALTH & GREENHOUSE GAS ISSUES Bruce E. Dale Dept. of Chemical Engineering & Materials Science Michigan State University Presented at: Energy Modeling Forum Snowmass, Colorado August 2-3, 2006
Presentation Overview • Why biofuels are going to be very big • How real are the concerns with biofuels? Some reasons for hope: • Integrating food and fuel production: protein & calories • Declining soil health & increased erosion: • Depends on crop grown, location, management practices • Not a factor with perennial grasses • Greenhouse gas production—nitrous oxide dominates • Depends on crop grown, location, management practices • Cover crop—improve environmental performance of grain-based ethanol • Net energy of biofuels—only if you really want to talk about this silly subject
Adapted from Lynd & Wyman Forages & hay crops Our margin for processing: here to here Plant material is much, much cheaper than oil on both energy & mass basis
Impact of Processing Improvements: Oil’s Past & Future • Historically, petrochemical processing costs exceeded feedstock costs • Petroleum processing efficiencies have increased and costs have decreased dramatically but reaching point of diminishing returns • Petroleum raw materials have long-term issues • Costs will continue to increase as supplies tighten • High price variability • Impacts national security • Climate security concerns • Not renewable Relative Cost Processing Oil From J. Stoppert, 2005
Impact of Processing Improvements: The Future of Biomass Conversion • Processing is dominant cost of biofuels today • Cellulosic raw material costs should be stable or even decrease long-term • Renewable resource • Potential for very large yield increases • Biomass processing costs will decrease: Key question is how far and how fast • For ethanol from cellulosics: • Pretreatment costs • Enzyme costs • Fermentation costs Relative Cost Processing ? Fermentation Feedstocks Grain Adapted from J. Stoppert, 2005
Significance of the 1.3 Billion Ton Biomass Scenario Based on ORNL & USDA Resource Assessment Study by Perlach et.al. (April 2005) http://www.eere.energy.gov/biomass/pdfs/final_billionton_vision_report2.pdf
Presentation Overview • Why biofuels are going to be very big • How real are the concerns with biofuels? Some reasons for hope: • Integrating food and fuel production: protein & calories • Declining soil health & increased erosion: • Depends on crop grown, location, management practices • Not a factor with perennial grasses • Greenhouse gas production—nitrous oxide dominates • Depends on crop grown, location, management practices • Cover crop—improve environmental performance of grain-based ethanol • Net energy of biofuels—only if you really want to talk about this silly subject
Some Expressions of these Concerns* • “Anything but a marginal contribution from biofuel would pose a serious threat to both food security and the natural resource base” • “Koonin’s analysis does not address the environmental costs (specifically land degradation) of producing biofuels” • “…the ecological devastation wrought by industrial biofuel production must be severe.” • “Ethanol from corn is neither scalable nor sustainable.” • “…the production of relatively inefficient transportation fuels at the expense of soil resources and in the face of increasing global populations is irresponsible.” • *All from Science. Vol. 312. 23 June 2006. Letters.
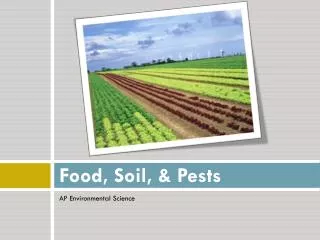
Will People Go Hungry Because of Biofuels? • Macronutrients: 2000 cal & 50 gm protein/person/day • Total U.S. human demand: 205 trillion cal & 5.1 trillion grams protein/yr • Three major U.S. crops alone (corn, soy, wheat) produce 1300 trillion kcal & 51 trillion grams protein/yr • Could meet U.S. human demand for protein & calories with 25 million acres of corn • Most U. S. agricultural production is fed to animals-- i.e., we are meeting their protein/calorie needs from our land resources. Their needs are: • 1040 trillion kcal/yr • 56.6 trillion gm protein/yr • Animal demands in U. S. are: • 5x human demands for calories • 10x human demand for protein
TOWARD A SUSTAINABLE ECONOMY “ALL BIOMASS IS LOCAL”
Two Features of Large Scale Cellulosic Biofuels • Effective, economical pretreatment to increase accessibility/digestibility of cellulose and hemicellulose (60-80% of grasses, etc). Such a pretreatment will also make these sugars available for ruminant animals (2/3 of total calorie demand by U. S. livestock) • Complete utilization of all biomass components: carbohydrates, lignin, protein, lipids, minerals, pigments, pectin, organic acids, etc. Why not recover this protein in the biorefinery and use it for animal feeding?(Yes, its amino acid quality is more than adequate.)
What Might the Future Look Like? • Land available (million acres) • Cropland (430): corn, wheat, soy, sorghum, alfalfa, hay, CRP • Permanent pasture (570)- half suitable for mechanical harvest • Most of these acres suitable for perennial grasses • Does NOT include forests • Assume a pretreated perennial grass yielding 10 tons/acre/yr with 10% protein, 75% cellulose + hemicellulose (90% digestible), 15% lignin and ash • Supply ruminants 710 trillion cal/yr & 36 trillion grams protein/yr using ~40 million acres of productive grasses • Leaves available >500 million acres for other feeds, human foods and biofuel production • I simply do not agree that land for food is a limiting resource for biofuel production
Miscanthus: Nitrogen Use Efficiency SPRING/ FALL WINTER SUMMER Mineral nutrients Mineral nutrients Translocation Lignocellulose Translocation from rhizomes dry shoots to rhizome as to growing harvested, shoot shoot nutrients stay in senesces rhizomes Courtesy of Dr. Steve Long, 2005
Presentation Overview • Why biofuels are going to be very big • How real are the concerns with biofuels? Some reasons for hope: • Integrating food and fuel production: protein & calories • Declining soil health & increased erosion: • Depends on crop grown, location, management practices • Not a factor with perennial grasses • Greenhouse gas production—nitrous oxide dominates • Depends on crop grown, location, management practices • Cover crop—improve environmental performance of grain-based ethanol • Net energy of biofuels—only if you really want to talk about this silly subject
Cornfield in June Alfalfa round bales in June
Cornfield in October Alfalfa in October
Presentation Overview • Why biofuels are going to be very big • How real are the concerns with biofuels? Some reasons for hope: • Integrating food and fuel production: protein & calories • Declining soil health & increased erosion: • Depends on crop grown, location, management practices • Not a factor with perennial grasses • Greenhouse gas production—nitrous oxide dominates • Depends on crop grown, location, management practices • Cover crop—improve environmental performance of grain-based ethanol • Net energy of biofuels—only if you really want to talk about this silly subject
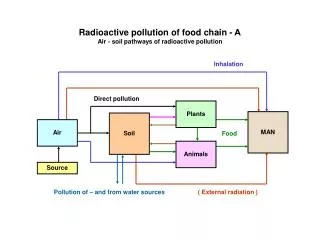
Soil Organic Carbon, CO2 & Nitrogen Dynamics • Simulated by the DAYCENT model • Predicting • Soil organic carbon level, CO2 • N2O and NOx emissions from soil, NO3- leaching • Information required • County-based soil textures • clay, slit, sand • County-based data • Daily maximum and minimum temperature • Daily precipitation • Cropping management • Tillage, application rate of nitrogen fertilizer, irrigation, etc
TOWARD A SUSTAINABLE ECONOMY “ALL BIOMASS IS LOCAL”
Farming sites • 38 counties in eight States (Indiana, Illinois, Iowa, Michigan, Minnesota, Missouri, Nebraska and South Dakota) • Determine soil organic carbon and soil nitrogen dynamics in the CORN system • Each county is adjacent to an ethanol plant (either a dry or wet mill) • Eight counties are chosen • To determine soil organic carbon and soil nitrogen dynamics in other cropping system • To estimate environmental performance of the ethanol application system.
Cropping Systems • Conventional corn cultivation (referred as CORN) • Collect no corn stover • Planting winter cover crops in the CORN system (referred as COVER) • Kill winter cover crop with herbicides before corn growing season • Conventional corn cultivation with harvesting corn stover (referred as STOVER) • Uutilize corn stover to produce ethanol in a lignocellulosic biorefinery
Winter Cover Crops in Corn Rotation Winter wheat crop May 5, 2005 Holt, MI
GHG Profile in the CORN System GHG of corn production: 1.2 ~ 4.8 ton CO2 per ha C-seq : carbon sequestration by soil Others: GHG emissions associated with agronomic inputs and fuel consumption
Effects of Cropping Systems GHG emissions CORN: 1.6 ~ 4.8 ton CO2 per ha STOVER: 1.8 ~ 4.7 ton CO2 per ha COVER: .08 ~ 3.0 ton CO2 per ha
Can Choice of Crop System Affect Environmental Performance of Biofuels? • Basic cropping system • Corn (plow till) – soybean (no-till): CPSN (grain) • Effect of winter cover crop under no-till corn continuous cultivation • 0 % of corn stover removed: CC (grain) (No winter cover crop) • Average 56 % of corn stover removed: CC (56%) (No winter cover crop) • Wheat and oat as winter cover crops with 70 % corn stover removal : CwCo (70%) • Effect of winter cover crop under no-till corn-soybean rotation • Wheat and oat as winter cover crops after corn cultivation with 70 % corn stover removal: CwSCo (70%) • Average 54 % of corn stover removed: CS (54%) (No winter cover crop) • Cover crop not assumed to be harvested—killed with herbicide
Dynamics of Soil Organic Carbon* CwCo (70%) CwSCo (70%) CC (grain) CS (54%) CC (56 %) CPSN (grain) *Washington County, Illinois
Inorganic Nitrogen Losses by Leaching* *40 year time scale, Washington County, Illinois
Greenhouse Gas Emissions per kg Carbohydrate (Washington County, IL) [560 g] [391 g] [229 g] [-9 g] [54 g] [235 g]
Presentation Overview • Why biofuels are going to be very big • How real are the concerns with biofuels? Some reasons for hope: • Integrating food and fuel production: protein & calories • Declining soil health & increased erosion: • Depends on crop grown, location, management practices • Not a factor with perennial grasses • Greenhouse gas production—nitrous oxide dominates • Depends on crop grown, location, management practices • Cover crop—improve environmental performance of grain-based ethanol • Net energy of biofuels—only if you really want to talk about this silly subject
RIP “NET ENERGY” 1979 – 2005 “WE COME TO BURY NET ENERGY, NOT TO PRAISE IT”
Most Recent Pimentel & Patzek Study*- Some Serious Deficiencies and Errors • Define ethanol’s % net energy as: • [(Ethanol Heating Value (LHV) – Fossil Energy Inputs) /Ethanol Heating Value (LHV)] x 100 • All BTU are treated as equivalent (1 BTU coal = 1 BTU petroleum = 1 BTU natural gas = 1 BTU electricity = and so on) • Confound “fossil fuels” with “liquid fossil fuels”=petroleum • They calculate net energy for ethanol from: • Corn - 29% • Switchgrass - 50% • Wood - 57% • They make no comparisons with other liquid fuels • *Natural Resources Research, vol. 14, No. 1, March 2005 pgs. 65-76
Petroleum Refining Refining input 9.6 BTU Fuel out 83.5 BTU Gasoline, diesel, jet fuel, LPG, residual oil, etc Crude oil 100 BTU Other non fuel products Production & Distribution Input 4.5 BTU 83.5 BTU – 114.1 BTU NET ENERGY = =- 37 % (vs.-29%) 83.5 BTU
Net Energy Reductio Ad Absurdum:the Accounting Analogy • “Net energy” is an energy accounting tool: a terrible one • Using the net energy approach of “All BTU are equal” an international company’s accountants would calculate: • 100 U.S. $ + 100 Pounds Sterling + 100 French francs + 100 lira = $400 U. S. • The math is right; the idea is absurd! • We cannot add up different forms of energy on a straight BTU basis any more than we can add up different currencies on a straight equivalency basis • Different forms of energy have different qualities—just like different currencies do
Pimentel & Patzek Confound Fossil Fuels & Petroleum Used for Ethanol Production I *Out of 21 different inputs. Adapted from Tables 1 & 2 of Pimentel & Patzek, NRR, 2005.
What Do Others Conclude about Pimentel and Patzek Studies? I* • “Studies** that reported negative net energy incorrectly ignored coproducts and used some obsolete data. • “All studies (two by P&P and four others) indicated that current corn ethanol technologies are much less petroleum-intensive than gasoline...” • Fig. 2. Corn ethanol yields (1.1/0.05) = 22x more liquid fuel than gasoline per unit of petroleum “invested” • *Farrell, et al, “Ethanol can Contribute to Energy and Environmental Goals” Science vol. 311. Jan. 2006 pg. 506-508 • **Refers to T. Patzek. Crit. Rev. Plant. Sci. 23, 219 (2004) & D. Pimentel and T. Patzek. Nat. Resource Res. 14, 65 (2005)
Fossil Energy Replacement Ratio:the Primary Climate Security Driver Energy Delivered to Customer Fossil Energy Ratio (FER) = Fossil Energy Used Source: J. Sheehan & M. Wang (2003)
Petroleum Replacement Ratio:the Primary Energy Security Driver Liquid Fuels Delivered to User Petroleum Replacement Ratio (PRR) = Petroleum Energy Used Adapted from Farrell, et al (2006)