Download
1 / 74
740 likes | 966 Vues
Observing the First Galaxies and the Reionization Epoch. Steve Furlanetto UCLA February 5, 2008. Outline. Introduction: Observing Reionization Galaxy Surveys Current observations of LAEs The Clustering Signature The 21 cm Transition as a Cosmological Probe Basic Physics

E N D
Observing the First Galaxiesand the Reionization Epoch Steve Furlanetto UCLA February 5, 2008
Outline • Introduction: Observing Reionization • Galaxy Surveys • Current observations of LAEs • The Clustering Signature • The 21 cm Transition as a Cosmological Probe • Basic Physics • The Mean 21 cm Background • Measurements and Challenges • The Pre-reionization IGM • Reionization • Conclusion
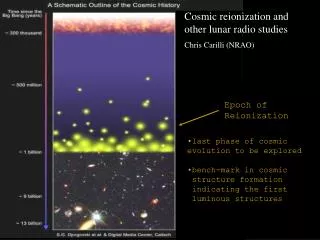
A Brief History of the Universe Big Bang • Last scattering: z=1089, t=379,000 yr • Today: z=0, t=13.7 Gyr • Reionization: z=6-20, t=0.2-1 Gyr • First galaxies: ? Last Scattering Dark Ages First Galaxies Reionization Galaxies, Clusters, etc. G. Djorgovski
Reionization • First stars and galaxies produce ionizing photons • Ionized bubbles grow and merge • Affects all baryons in the universe • Phase transition Mesinger & Furlanetto
Reionization • First stars and galaxies produce ionizing photons • Ionized bubbles grow and merge • Affects all baryons in the universe • Phase transition Mesinger & Furlanetto
Reionization • First stars and galaxies produce ionizing photons • Ionized bubbles grow and merge • Affects all baryons in the universe • Phase transition Mesinger & Furlanetto
Reionization • First stars and galaxies produce ionizing photons • Ionized bubbles grow and merge • Affects all baryons in the universe • Phase transition Mesinger & Furlanetto
Reionization:Observational Constraints • Quasars/GRBs • CMB optical depth • Ly-selected galaxies Furlanetto, Oh, & Briggs (2006)
Total optical depth in Ly transition: Damping wings are strong Lya Emitters and HII Regions IGM HI
LAEs During Reionization xH=0 xH=0.26 xH=0.51 xH=0.77 Mesinger & Furlanetto (2007) • z=9, R=125 observation, with M>1.7x10¹⁰ Msun • Galaxies in small bubbles (underdense regions) masked out by absorption
A Declining Number Density? • Largest survey to date with Subaru • Apparent decline at bright end • Disputed by Dawson et al. (2007) Kashikawa et al. (2006)
A Declining Number Density? • Similar behavior to z=7 • One (!) detection • L>1043 erg/s detection threshold Iye et al. (2006)
An Increasing Number Density? • Stark et al. (2007) found 6 candidate LAEs behind massive clusters • Search along lensing caustics • z=9-10 • L~1041-1042 erg/s • Most obvious interlopers ruled out Stark et al. (2007), z=9 Kashikawa et al. (2006)
An Increasing Number Density? • Solid curves show mass functions with absorption • Four scenarios for luminosities (right to left): • Same as z=6 LAEs • Same as z=6 LAEs, but Pop III • All baryons form Pop II stars, simultaneously • All baryons form Pop III stars, simultaneously • Reasonable scenarios require fully ionized! Mesinger & Furlanetto (2008)
LAE ClusteringDuring Reionization • Nearly randomly distributed galaxy population • Small bubble: too much extinction, disappears • Large bubble: galaxies visible to survey
LAE ClusteringDuring Reionization • Small bubble: too much extinction, disappears • Large bubble: galaxies visible to survey • Absorption selects large bubbles, which tend to surround clumps of galaxies
LAE ClusteringDuring Reionization • Small bubble: too much extinction, disappears • Large bubble: galaxies visible to survey • Absorption selects large bubbles, which tend to surround clumps of galaxies
Enhanced Clustering During Reionization • Shows enhanced probability to have N>1 galaxies in an occupied cell • Measuring requires deep survey over ~106-107 Mpc3 Mesinger & Furlanetto (2008)
The Future of LAE Surveys • Advantages: • Familiar strategies • Study galaxies as well • Disadvantages: • Uncertainties about galaxy formation • Need large volume, deep surveys • Indirect information about IGM
The Spin-Flip Transition • Proton and electron both have spin magnetic fields • Produces 21 cm radiation (n=1420 MHz) • Extremely weak transition • Mean lifetime ~107 yr • Optical depth ~1% in fully neutral IGM
The 21 cm Transition • Map emission (or absorption) from IGM gas • Requires no background sources • Spectral line: measure entire history • Direct measurement of IGM properties • No saturation! SF, AS, LH (2004)
The Spin Temperature • CMB photons drive toward invisibility: TS=TCMB • Collisions couple TS to TK • Dominated by electron exchange in H-H collisions in neutral medium (Zygelman 2005) • Dominated by H-e- collisions in partially ionized medium (Furlanetto & Furlanetto 2006), with some contribution from H-p collisions (Furlanetto & Furlanetto 2007)
The Global Signal:The Dark Ages • Straightforward physics • Expanding gas • Recombination • Compton scattering SF, PO, FB (2006)
The Wouthuysen-Field Mechanism I Selection Rules: DF=0,1 (except F=0 F=0) 2P3/2 1P3/2 1P1/2 0P1/2 1S1/2 Mechanism is effective with ~0.1 Ly photon/baryon 0S1/2
The Wouthuysen-FieldMechanism II • Relevant photons are continuum photons that redshift into the Ly resonance … Ly Ly Ly Ly
The Global Signal:First Light • First stars (quasars?) flood Universe with photons • W-F effect • Trigger absorption in cold IGM feedback Pop III Stars Pop II Stars SF (2006)
X-rays are highly penetrating in IGM Mean free path >Mpc Deposit energy as heat, ionization Produced by… Supernovae Stellar mass black holes Quasars Very massive stars The First Sources of Light:X-ray Heating
The Global Signal:First Light • First stars (quasars?) flood Universe with photons • W-F effect • Heating • Ionization • Timing depends on f*, fesc, fX, stellar population feedback Pop III Stars Pop II Stars SF (2006)
21 cm Observations • Experiments • Global Signal: CoRE-ATNF, EDGES • Fluctuations: 21CMA, LOFAR, MWA, GMRT, PAPER, SKA • Imaging: SKA MWA
Terrestrial Interference Bowman et al. (2007) • Mileura spectrum, 15 sec integrations • Two types: • Fixed site (low frequency filling factor) • Aircraft/meteor trail reflections (low duty cycle) • Basic strategy: excise contaminated channels
Ionospheric Distortions • Refraction in ionosphere distorts wavefronts • Analog of optical seeing layer • Solved on software level with calibration sources • Challenge: wide-field imaging W. Cotton
Astronomical Foregrounds • Map at 150 MHz • Contours are in Kelvin Landecker et al. (1969)
The Synchrotron Foregrounds • A single synchrotron electron produces a broad but smooth spectrum Intensity B Frequency e- path
The Synchrotron Foregrounds • A single synchrotron electron produces a broad but smooth spectrum • Electron velocity scales the spectrum Intensity Frequency
The Synchrotron Foregrounds • Synchrotron spectrum mirrors distribution of fast electrons • Typically near power-law, with ~K/MHz gradient Intensity Frequency
Measuring the Global Signal? • Signal gradient is few mK/MHz • Foregrounds vary as (near) power law • Synchrotron, free-free • Gradient is few K/MHz • CoRE-ATNF, EDGES experiments are trying • Distinctive shape may help SF (2006)
Foregrounds on Small Scales 0.5 MHz
Foreground Removal Total Signal ~ 400 K Tb • Removal algorithms fairly well-developed Zaldarriaga et al. (2004), Morales & Hewitt (2004), Santos et al. (2005), McQuinn et al. (2007) Cleaned Signal ~ 10 mK Frequency
Foreground Noise • Thermal noise is NOT smooth: varies between each channel • For first generation instruments, 1000 hr observations still have S/N<1 per pixel • Imaging is not possible until SKA!
The Murchison Widefield Array • Low Frequency Demonstrator under construction (fully funded, first light ~2008) • Located on sheep ranch in Western Australia Bowman et al. (2007)
The Murchison Widefield Array • Bowtie antennae grouped in tiles of 16 • Broad frequency response • Large field of view Bowman et al. (2007)
Murchison Widefield Array:Low Frequency Demonstrator • Instrument characteristics • Radio-quiet site • 500 16-element antennae in 1.5 km distribution • 7000 m2 total collecting area • Full cross-correlation of all 500 antennae • 80-300 MHz • 32 MHz instantaneous bandwidth at 8 kHz resolution • 20-30 degree field of view Bowman et al. (2007)
Error Estimates: z=8 • Survey parameters • z=8 • Tsys=440 K • tint=1000 hr • B=6 MHz • No systematics! • MWA (solid black) • Aeff=7000 m2 • 1.5 km core • SKA (dotted blue) • Aeff=1 km2 • 5 km core • LOFAR very close to MWA MWA SKA Foreground limit (Mpc-1)
Error Estimates: z=12 • Survey parameters • z=12 • Tsys=1000 K • tint=1000 hr • B=6 MHz • No systematics! • MWA (solid black) • Aeff=9000 m2 • 1.5 km core • SKA (dotted blue) • Aeff=1 km2 • 5 km core MWA SKA Foreground limit (Mpc-1)
That’s a whole lotta trouble… So what good is it, really?
The Global Signal • Four Phases • Dark Ages • First Stars • First Black Holes • Reionization Reionization BHs Stars Dark Ages SF (2006)
Ly Fluctuations • Ly photons decrease TS near sources (Barkana & Loeb 2004) • Clustering • 1/r2 flux • Strong absorption near dense gas, weak absorption in voids Cold, Absorbing Cold, invisible
Ly Fluctuations Cold, Absorbing • Ly photons decrease TS near sources • Clustering • 1/r2 flux • Strong absorption near dense gas, weak absorption in voids • Eventually saturates when IGM coupled everywhere
The Pre-Reionization Era • Thick lines: Pop II model, zr=7 • Thin lines: Pop III model, zr=7 • Dashed: Ly fluctuations • Dotted: Heating fluctuations • Solid: Net signal X-ray Net Ly Pritchard & Furlanetto (2007)
X-ray Fluctuations • X-ray photons increase TK near sources (Pritchard & Furlanetto 2007) • Clustering • 1/r2 flux • Hot IGM near dense gas, cool IGM near voids Hot Cool