
Correlation Between Computerized Visual Acuity and Light Box Testing Scores
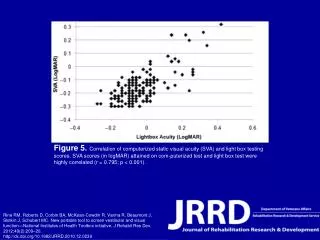
This study investigates the correlation between computerized static visual acuity (SVA) and light box testing scores. The findings reveal a strong correlation (r = 0.795; p < 0.001) between the logMAR scores from the computerized test and those from the light box test. This research is significant for developing portable tools to assess vestibular and visual functions as part of the National Institutes of Health Toolbox initiative. The results highlight the reliability of using computerized tests in clinical settings for visual assessments.

Correlation Between Computerized Visual Acuity and Light Box Testing Scores
E N D
Presentation Transcript
Figure 5. Correlation of computerized static visual acuity (SVA) and light box testing scores. SVA scores (in logMAR) attained on com-puterized test and light box test were highly correlated (r = 0.795; p < 0.001). Rine RM, Roberts D, Corbin BA, McKean-Cowdin R, Varma R, Beaumont J, Slotkin J, Schubert MC. New portable tool to screen vestibular and visual function—National Institutes of Health Toolbox initiative. J Rehabil Res Dev. 2012;49(2):209–20.http://dx.doi.org/10.1682/JRRD.2010.12.0239