Download

1 / 19
190 likes | 354 Vues
Chap. 5 Molecular Genetic Techniques (Part C). Topics Identifying and Locating Human Disease Genes Inactivating the Function of Specific Genes in Eukaryotes. Goals Learn genetic and recombinant DNA methods for isolating genes and characterizing the functions of the proteins they encode. .

E N D
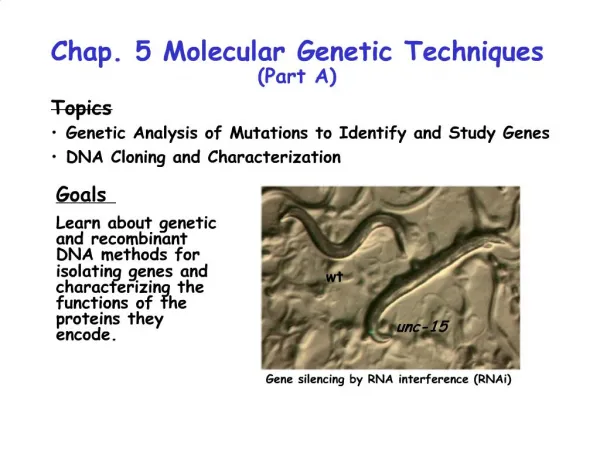
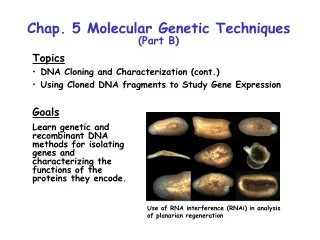
Chap. 5 Molecular Genetic Techniques (Part C) • Topics • Identifying and Locating Human Disease Genes • Inactivating the Function of Specific Genes in Eukaryotes Goals Learn genetic and recombinant DNA methods for isolating genes and characterizing the functions of the proteins they encode. Use of RNA interference (RNAi) in analysis of planarian regeneration
Overview of Identifying & Locating Human Disease Genes Human geneticists use multiple approaches to find genes responsible for inherited diseases. Typically, the family inheritance pattern of the disease initially is determined (Fig. 5.35). Subsequently, researchers try to find genetic markers (e.g., SNPs, Fig. 5.36) that consistently are linked to the disease. This information and sometimes linkage disequilibrium analysis (Fig. 5.37) further helps investigators home in on the gene's approximate chromosomal location. Finally, DNA sequencing and other procedures are used to pinpoint the location of the responsible gene. The relationship between the cytogenetic and physical maps of a human chromosome is illustrated in Fig. 5.38.
Common Hereditary Human Diseases Most inherited diseases are caused by preexisting mutant alleles that have been passed down from one generation to the next. Examples of common autosomal recessive, autosomal dominant, and X-linked recessive human diseases of monogenic origin are listed in Table 5.2. At least some fraction of diseases such as cancers, diabetes, obesity, and heart disease are hereditary and polygenic in origin. The molecular bases of these diseases are even harder to solve than those of monogenic diseases. * * *
Human Disease Inheritance Patterns One of the first procedures performed in identifying a disease gene is to establish its inheritance pattern in affected families (Fig. 5.35). Analysis of inheritance patterns can quickly establish if the disease gene is carried on an autosome or a sex chromosome. Examples of inheritance patterns (family segregation) for autosomal dominant (Huntington's disease), autosomal recessive (cystic fibrosis), and X-linked recessive (Duchenne's muscular dystrophy) genetic diseases are 50% 25% 50% illustrated in the diagram. In autosomal dominant diseases, male and female children each have a 50% chance of developing the disease. In autosomal recessive diseases, both sexes have a 25% chance of developing the disease. In X-linked recessive diseases, males have a 50% chance of developing the disease. In this case, the defective allele is inherited from the mother.
Linkage Mapping Using Molecular Markers The next step in gene ID is to genetically map its position with respect to known genetic markers in the genome. This method can be performed by breeding studies in simple experimental organisms in which genetic markers confer readily detectable phenotypes. However such phenotypic markers are uncommon in humans, and instead DNA-based molecular markers are used. Molecular markers caused by DNA polymorphisms (sequence differences) occur at a frequency of about 1/1,000 nucleotides. Polymorphisms are used as landmarks in locating the position of a disease gene. In some cases, polymorphisms change the locations of restriction sites. This results in restriction fragment length polymorphisms (RLFPs) which can be used in linkage studies. Other DNA polymorphisms do not affect restriction sites. These molecular markers--called single nucleotide polymorphisms (SNPs) and simple sequence repeats (SSRs)--can be identified and studied by PCR amplification and sequencing of genomic DNA.
SNP Analysis of Pedigrees The use of SNP analysis in following disease gene inheritance in a family is illustrated in Fig. 5.36. In the family shown, the region of the chromosome being studied occurs in 3 forms based on the 3 different SNPs observed via sequencing of this region (A, T, or C). The analysis indicates that the disease trait segregates with a C at the SNP site. Currently, about 104 DNA polymorphisms have been mapped in the human genome. Researchers screen DNA from individuals with genetic diseases to try to find polymorphisms that are linked to a disease gene. Pooled data from multiple families helps in identifying polymorphisms linked to the gene. SNP analysis also is used in diagnostics and genetic counseling. Key: Circles indicate females; squares indicate males. Blue indicates unaffected individuals; orange indicates individuals with the disease.
Linkage Mapping of Disease Gene Location by Recombination Analysis Although it is not commonly used in analysis of human diseases, it is instructive to consider the procedure known as recombination analysis (Fig. 5.10), which is often applied in linkage analysis in simple model organisms. This method relies on the facts that, phenotypic traits that segregate together during meiosis more frequently than expected based on random segregation typically are specified by genes residing on the same chromosome. In addition, the less frequently recombination occurs between two markers on a chromosome, the more tightly they are linked and the closer together they are. One genetic map unit is defined as the distance between two genes along a chromosome that results in a 1% (1/100 gametes) recombination frequency (1 centimorgan, cM). In humans, 1 cM corresponds to a physical distance of ~750,000 bp.
Linkage Disequilibrium Analysis of Disease Gene Location In linkage disequilibrim analysis, investigators map the location of a disease gene on a chromosome by looking for regions that maintain the same grouping of linked genetic markers as in the ancestral chromosome in which the disease gene arose (Fig. 5.37). Markers that are unlinked to the mutant gene recombine extensively over generations, whereas markers closely linked to the disease allele do not. Linkage disequilibrium analysis can sometimes improve the resolution of genetic mapping studies to 0.1 cM.
Final Steps of Mutant Gene Isolation Often mutations can be mapped only to 1 cM regions of human DNA using the methods discussed above (Fig. 5.38). Regions of this length can contain dozens of genes. The final identification of the disease gene typically involves sequencing and mapping of all SNPs, etc. in a long region of DNA. The responsible gene is likely to be located in regions where SNPs associated with the disease consistently are found in a number of affected individuals. The mutation itself eventually is identified by DNA sequencing. The analysis of gene expression by Northern blotting and in situ hybridization in affected tissues also may help in identifying a disease gene in cases where grossly defective mRNA transcripts are produced from a gene.
Leptin Receptor Knockout Mice db/dbDB/DB
Gene Replacement by Homologous Recombination In bacteria and yeast, specific genes can be replaced or disrupted by homologous recombination methods (Fig. 5.39). To disrupt yeast genes, a disruption construct consisting of the kanMX antibiotic resistance marker fused to 20-nt sequences that flank the targeted gene is made by PCR and transformed into diploid yeast. Recombinants in which the disruption construct has replaced one wild type allele are selected by plating cells on G-418. On sporulation, half of the haploid spores receive the disrupted gene. If the gene is essential, these two spores will be nonviable. This method has been used to show that only 1,500 of the total 6,000 yeast genes are essential at least under laboratory conditions. Synthetic lethality screens are now being conducted to group genes with redundant functions.
Knockout Mice: Stem Cell Manipulations I In knockout mice, both copies of a gene of interest are disrupted by targeted homologous recombination. First, a DNA construct containing a disrupted allele of a particular gene (X) is introduced into embryonic stem (ES) cells (Fig. 5.40a). In a small percentage of cells, homologous recombination occurs and the target gene is replaced with a copy of the neo r gene (G-148 resistance). In most cells, the DNA construct recombines nonhomologously and inserts at another site in the genome. The entire DNA construct typically inserts into the genome via nonhomologous recombination. This results in cointegration of neo r and a copy of the herpes simplex virus thymidine kinase gene (tkHSV).
Knockout Mice: Stem Cell Manipulations II ES cells carrying the neo r gene then are selected by growing the mixed population of cells on G-148 (positive selection) (Fig. 5.40b). Subsequently, cells obtained by nonhomologous recombination are eliminated (negative selection) by growing cells in the presence of the nucleoside analog, ganciclovir. Ganciclovir is converted into a toxic nucleotide by the tkHSV gene product which blocks DNA replication in these cells. The resulting culture contains only ES cells with a targeted disruption in one copy of gene X (genotype: X-/X+).
Knockout Mice: In Vivo Manipulations I In the next step, the ES cells are injected into the blastocoel cavity of a 4.5-day old mouse embryo (Fig. 5.41). The embryo then is introduced into a pseudopregnant female (foster mother) who gives birth to some chimeric progeny containing the knockout gene. In chimeras, different tissues have different genotypes.To facilitate isolation of genetically pure lines of knockout mice, the original ES cells are obtained from dominant brown (A) mice of the A/A, X-/X+ genotype. A recessive black (a) mice of the a/a, X+/X+ genotype is the source of the blastocyst. Homozygous knockout mice are isolated after performing the crosses shown on the next two slides.
Knockout Mice: In Vivo Manipulations II In the first cross, a chimeric mouse is mated with a black mouse that is homozygous for the wild type X allele. Possible germ cells from the chimeric mouse are shown in the figure. The brown progeny of this cross will be derived from the ES cells. Repeated matings and genotype screenings are performed until X-/X- homozygous knockout mice are obtained. In many cases, germ-line knockout mice are nonviable. Thus, alternative strategies for knocking out a gene of interest in a later stage of life have been developed (Fig. 5.42, not covered).
Transgenic Mice In knockout mice, both copies of a wild type allele are inactivated to observe a recessive trait. In transgenic mice, an allele specifying a dominant negative mutation is introduced into the germ line DNA. Animals need express only one copy of such an allele to exhibit a phenotype. The method for introduction of transgenes into mice is shown in Fig. 5.43. A copy of the dominant negative allele typically inserts into the genome via nonhomologous recombination. Often the transgene is controlled by a regulated promoter, allowing it to be expressed in certain tissues at certain times.
Example of a Dominant Negative Allele Only one copy of a dominant negative allele is required to cause a loss-of-function phenotype in a diploid organism. A classic example of this type of mutation is shown in Fig. 5.44. Certain mutant forms of "small GTPases" form extremely long-lived complexes with GEF proteins (guanine nucleotide exchange factors). GEF proteins catalyze exchange of GTP for GDP and activation of GTPases. In cells expressing both the wild type and dominant-negative GTPase alleles, all copies of GEF become complexed with the mutant GTPase, blocking the switching function of the wild type GTPase.
RNA Interference (RNAi) In RNA interference, short interfering RNAs (siRNAs, ~21 nts) produced from longer dsRNAs specifically block gene expression by binding to a target mRNA and triggering its degradation. dsRNAs can be transcribed in vitro and injected into an embryo, for example, where processing by the enzyme known as dicer produces the siRNA (Fig. 5.45 a & b). Alternatively, dsRNA can be expressed in vivo in response to some signal. Subsequent processing to siRNA by dicer then triggers mRNA degradation (Fig. 5.45c). RNAi-mediated gene inactivation is commonly applied to silence gene expression in C. elegans, Drosophila, plants, and even mice. The mechanism by which siRNAs cause mRNA degradation is covered in Chap. 8.