Background
10 likes | 147 Vues
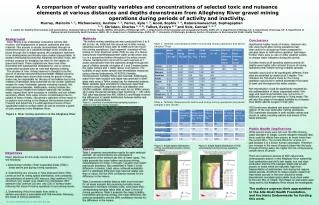
A comparison of water quality variables and concentrations of selected toxic and nuisance elements at various distances and depths downstream from Allegheny River gravel mining operations during periods of activity and inactivity.

Background
E N D
Presentation Transcript
A comparison of water quality variables and concentrations of selected toxic and nuisance elements at various distances and depths downstream from Allegheny River gravel mining operations during periods of activity and inactivity. Murray, Malcolm 1, 2, Michanowicz, Andrew 1, 2, Ferrer, Kyle 1, 3, Good, Sophia 1, 4, Ratanamaneechat, Suphagaphan 1, 2, Christen, Charles 1, 2, 5, Talbot, Evelyn 6, 7 and Volz, Conrad 1, 2, 7 1. Center for Healthy Environments and Communities, Graduate School of Public Health (GSPH), University of Pittsburgh (UP). 2. Department of Environmental and Occupational Health, GSPH, UP. 3. Department of Biology, UP. 4. Department of Geology, UP. 5. Department of Behavioral and Community Health Sciences, GSPH, UP. 6. Department of Epidemiology, GSPH, UP. 7. University of Pittsburgh, Academic Center of Excellence in Environmental Public Health Tracking. Methods Background Conclusions The before mining sampling set was conducted from 3 to 5 AM on July 18, 2008 and the second set of after mining sampling occured 5 hours later at 10AM.(over two hours into mining operations). Each segment consisted of first testing for total dissolved solids (TDS) by way of a Hanna Instruments 9128 Multiparameter water probe which was run in a serpentine fashion throughout the entire control volume. Sampling then occurred for each segment at 7 points downstream from the clamshell dredge through the use of a Niskin sampler at depths of 1 and 3 meters below the water surface and 1 meter above river bottom. The turbidity of each water sample was immediately measured using a Hanna Instruments, HI 93703, Portable Microprocessor Turbidity Meter and recorded. Additionally, water from each location and depth was archived in 50ml glass vials using a Teflon coated cap for elemental analysis. Water samples were analyzed for previously described elements using EPA approved nitric acid digestion and ICP/MS methods. Statistical tests were run on SPSS version 16.0 using the paired samples t-test function(p = .05) while TDS data was placed into ARC VIEW 9.3 and Kriged to show the differences in spatial distribution between before and after TDS concentrations. River Mining is an underwater excavation activity that involves the displacement of bottom sediments and rock material. This process is usually accomplished through an instrument known as a clamshell dredge which scrapes and plows through the riverbed causing the complacent sediment to be disintegrated and thereby more readily transportable. In western Pennsylvania along the Allegheny and Ohio rivers, the primary purpose for dredging has been for the uptake of gravel and sand. These materials are then most often processed and subsequently developed for use on various construction projects such as road and highway building. The process of river mining however is thought to be the source of several environmental and health related concerns. Several studies have shown that mining for gravel in these areas may be responsible for the loss of ecohabitat due to the creation of attendant deep holes that do not contain sufficient oxygen for many freshwater species including mussels, fish and macroinvertebrates. Additionally, mining initiates the release of toxic metals from bottom sediment into surface water, causes short term increases in turbidity and can initiate secondary effects from water column contamination due to uptake of heavy metals. The primary objective of this report is to explore river mining in the Western Pennsylvania town of Freeport and determine if it adds significant levels of total suspended solids to surface water as well as increase a panel of toxic elements in the Allegheny River. Table 1. Element concentrations before and during mining operations and Paired Samples T-test Significantly higher levels of arsenic, selenium and zinc were found after mining operations had been active for at least two hours compared to samples taken at 3AM before operation had begun. Further there were no rain or other weather events to change water indicators during this period. Turbidity levels at all sampling stations and at all depths were higher after at least 2 hours of mining operations than before mining turbidity samples Turbidity was found to be significantly different if the data are stratified by depth at all 3 depths. This indicates the TSS plume made by the mining operation was found to extend essentially from bank to bank and throughout the water column. Fish reproduction could be significantly impaired by the sedimentation of these suspended solids. Fish eggs and macroinvertebrates may not survive if sediment is layered over nesting or living areas. Fish will also flee areas of increased turbidity as it impairs their ability absorb oxygen in their gills. TDS levels were elevated and areas enlarged on the interior of the river bend after mining operations. TDS represents increases in both soluble cations and anions in water, including cations and anions of the listed elements. Table 2. Turbidity Measurements before and during mining operations and paired samples t-test results Figure 2. Locations of predetermined sampling locations – relative to the river mining operation Figure 1. River mining operation on the Allegheny River Public Health Implications • While arsenic levels were not over the EPA drinking • water standard of 10ppb, current research indicates that • there could be effects from arsenic at levels lower than • the current MCL. The current MCLG for arsenic is 0 • ppb because it is a known human carcinogen. Therefore • any increase in the mass of arsenic taken into the body • through drinking water, the higher the risk of developing • certain forms of cancer. • There are numerous sources of both natural and • anthropogenic arsenic in the Allegheny River watershed. • Coal combustion and its fly ash waste, iron and steel • production and the PPG Cadogan Waste site all add • arsenic to levels which are naturally high from • fragmentation of sedimentary rock during the regions • glacial periods. All efforts to reduce arsenic mass from • man-made sources in the river should be made. • Downstream municipal water plants must clean water • to the new MCL of 10ppb. The impact on well water users • living next to the Allegheny River should be investigated. Figure 3. Kriged Spatial Distribution of TDS concentrations before mining operations. Figure 4. Kriged Spatial Distribution of TDS concentrations during mining operations. Results Table 1 presents concentration results for each analyzed element. All concentrations are expressed in micrograms of the element per liter of water (ppb). The table presents the mean before and during mining concentrations for drops 1 through 7 at each river depth previously described. Also presented in Table 1 is the difference in means, t-test value, achieved probability and if a significant difference was reported (alpha less than or equal .05) the 95% confidence interval for the difference in the means. Table 2 presents turbidity data by both river level and for all levels merged. All pre-mining turbidity levels, measured in Formazin Turbidity Units, were lower than corresponding samples taken after at least 2 hours of mining operations. Table 2 presents the mean turbidity level before and during mining, the mean difference, the achieved probability and the 95% confidence interval for the difference in the means. Objectives Major objectives for this study include but are not limited to the following: 1.Determining turbidity (Total Suspended Solids [TSS] ) levels before and during mining operations. 2. Determining any increase in Total Dissolved Solid (TDS) Levels as well as noting spatial distribution, and comparing concentrations of arsenic (As) mercury (Hg) cadmium (Cd) chromium (Cr) copper (Cu) cobalt (Co) manganese (Mn) selenium (Se) uranium (U) and zinc (Zn) in surface water following the onset of mining operations to pre-mining levels. 3. Determining if the river depth from which a sample was taken is associated with TSS elevation following the onset of mining operations. The authors express their appreciation to the Alle-Kiski Health Foundation, and the Heinz Endowments for funding this work. For more information go to www.chec.pitt.edu


