Download
1 / 18
180 likes | 289 Vues
Learn from this tutorial how the Department of Homeland Security utilizes visualizations to address security issues, with case studies like Jigsaw and PanViz. Discover the impact of visual analytics in safety operations and explore COE Explorer for a comprehensive understanding.

E N D
Visual AnalyticsDetect the ExpectedDiscover the UnexpectedA Tutorial for Middle School and High School Teachers Module 4- Department of Homeland Security (DHS): Why and How They Use Visualizations
Tutorial Outline Introduction Module 1What is Visual Analytics? Module 2 Proper Visualization Construction and Use Module 3 Misinformation and Lying with Graphics Module 4Department of Homeland Security (DHS):Why and How They Use Visualizations Module 5 Understandable Applications Module 6 Exercises and Resources for the Classroom Conclusion
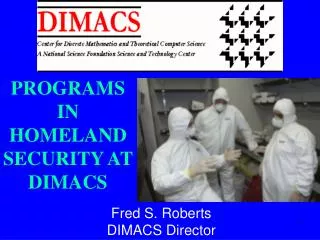
Dept of Homeland Security Background Dept of Homeland Security Interest in Visual Analytics Projects Using Visual Analytics Module 4 –DHS: Why and How They Use Visualizations
Department of Homeland Security and Visual Analytics • VACCINE – Visual Analytics COE (Center of Excellence) • Help security and safety personnel • Turn massive amount of data into valuable information
DHS Projects Address a Variety of Security Issues
Jigsaw: Visual Analytics for Investigative Analysis • Document Exploration Tool • Entities Extracted from Document • Links Between Dates, People, Places
VALET: Visual Analytics Law Enforcement Tool Map Crime Data Through Space & Time
PanViz: Pandemic Flu Visualization • Simulation to Help Responders • Effectiveness of preventative measures • Resource management • Planning • Based Off Data From 1918 Flu Pandemic
Rosetta Phone: Foreign Language Sign Translation • Translation of Non-Roman Alphabet • Cell Phone Based
CoE: Center of Excellence Explorer • Explore Relationship Between COEs • Projects • People • Institutions
Conclusion • Visual Analytics Vital to DHS Mission • Various Application Areas in Development
Additional Resources • VACCINE: • http://visualanalytics-cci.org • Jigsaw: http://www.cc.gatech.edu/gvu/ii/jigsaw/ • COE Explorer: https://engineering.purdue.edu/~elm/projects/coe-explorer/
Classroom Exercises • Brainstorm Uses of VA for COEs • Analyze One of Featured Projects
Tutorial Outline Introduction Module 1What is Visual Analytics? Module 2 Proper Visualization Construction and Use Module 3 Misinformation and Lying with Graphics Module 4 Department of Homeland Security (DHS): Why and How They Use Visualizations Module 5 Understandable Applications Module 6 Exercises and Resources for the Classroom Conclusion