A. CONCEPT
C. PHOTONIC BAND GAP TUNING. The PBG was blue-shifted or red-shifted continuously as a function of the electric field strength or drive frequency.

A. CONCEPT
E N D
Presentation Transcript
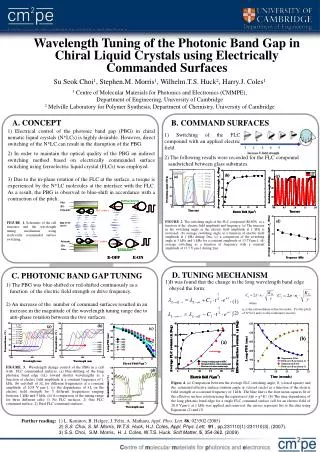
C. PHOTONIC BAND GAP TUNING • The PBG was blue-shifted or red-shifted continuously as a function of the electric field strength or drive frequency. • 2) An increase of the number of command surfaces resulted in an increase in the magnitude of the wavelength tuning range due to anti-phase rotation between the two surfaces. FIGURE. 3. Wavelength change control of the PBG in a cell with FLC commanded surfaces. (a) blue-shifting of the long photonic band edge (L) toward shorter wavelengths as a function of electric field amplitude at a constant frequency of 1 kHz, (b) red-shift of L for different frequencies at a constant amplitude of 20.8 V μm-1, (c) the dependence of L on the electric field strength for 5 different frequencies ranging between 1 kHz and 5 kHz, (d) A comparison of the tuning range for three different cells: 1) No FLC surfaces, 2) One FLC command surface, 2) Dual FLC command surfaces. B. COMMAND SURFACES 2) The following results were recorded for the FLC compound sandwiched between glass substrates. FIGURE 2. The switching angle of the FLC compound (R1809) as a function of the electric field amplitude and frequency. (a) The increase in the switching angle as the electric field amplitude at 1 kHz is increased, (b) average switching angle as a function of electric field amplitude at 1 kHz during 2ms, (c) a comparison of the switching angle at 5 kHz and 1 kHz for a constant amplitude of 13.7Vμm-1, (d) average switching as a function of frequency with a constant amplitude of 13.7 V μm-1 during 2ms. Wavelength Tuning of the Photonic Band Gap in Chiral Liquid Crystals using Electrically Commanded Surfaces Su Seok Choi1, Stephen.M. Morris1, Wilhelm.T.S. Huck2, Harry.J. Coles1 1Centre of Molecular Materials for Photonics and Electronics (CMMPE),Department of Engineering, University of Cambridge2 Melville Laboratory for Polymer Synthesis, Department of Chemistry, University of Cambridge A. CONCEPT • 1) Electrical control of the photonic band gap (PBG) in chiralnematic liquid crystals (N*LCs) is highly desirable. However, direct switching of the N*LC can result in the disruption of the PBG. • 2) In order to maintain the optical quality of the PBG an indirect switching method based on electrically commanded surface switching using ferroelectric liquid crystal (FLCs) was employed. • 3) Due to the in-plane rotation of the FLC at the surface, a torque is experienced by the N*LC molecules at the interface with the FLC. As a result, the PBG is observed to blue-shift in accordance with a contraction of the pitch. 1) Switching of the FLC compound with an applied electric field. FIGURE 1. Schematic of the cell structure and the wavelength tuning mechanism using electrically commanded surface switching. D. TUNING MECHANISM • It was found that the change in the long wavelength band edge obeyed the form: (1) where ne is the extraordinary refractive index , P is the pitch of N*LCs and γ is the rotational viscosity (2) Figure 4. (a) Comparison between the average FLC switching angle, , (closed square) and the estimated effective surface rotation angle, , (closed circle) as a function of the electric field strength at a constant frequency of 1 kHz. The blue line is the least mean squares fit of the effective surface rotation using the equation of f() = g*Ea. (b) The time dependence of the long photonic band edge for a single FLC command surface cell for an electric field of 20.8 Vμm-1 at 1 kHz was applied and removed, the curves represent fits to the data using Equations (2) and (3). Further reading:1) L. Komitov, B. Helgee, J. Felix, A. Matharu, Appl. Phys. Lett. 86, 023502 (2005) 2) S.S. Choi, S. M. Morris, W.T.S. Huck, H.J. Coles, Appl. Phys. Lett, 91, pp.231110(1)-231110(3), (2007). 3) S.S. Choi, S.M. Morris, H. J. Coles, W.T.S. Huck, Soft Matter, 5, 354-362, (2009)