Download
1 / 29
290 likes | 566 Vues
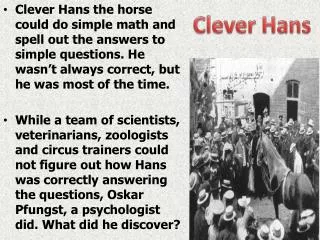
Clever H ans. Clever Hans the horse could do simple math and spell out the answers to simple questions. He wasn’t always correct, but he was most of the time.

E N D
Clever Hans • Clever Hans the horse could do simple math and spell out the answers to simple questions. He wasn’t always correct, but he was most of the time. • While a team of scientists, veterinarians, zoologists and circus trainers could not figure out how Hans was correctly answering the questions, Oskar Pfungst, a psychologist did. What did he discover?
The Secret • While Hans could not do math, or correctly answer questions on his own, he was very perceptive. • Hans was picking up on subtle body language given off by his owner who asked the questions. • When the owner was hidden from view, suddenly Hans could not answer the questions correctly. • How does this story relate to research and Psychology?
Psychology's Main Goal • The goal of psychology is to develop explanations for behavior and mental processes…explain why we do what we do. • These explanations, based on solid empirical studies are called theories. • A theory is a testable explanation for a set of facts or observations. • http://education-portal.com/academy/lesson/types-of-research-designs.html
Internal Assessment • Students will plan, conduct, and report on a simple experimental study • The simple experiment enables students to experience the research process • The experiment will be a replication of a previously published study • Characteristics of the simple study: • 1. Limited in scope • 2. Involves the manipulation of ONE independent variable (the factor that is manipulated by the researcher to determine its effect on another variable) • 3. Involves the measurement of ONE dependent variable (the factor that is being measured and that may change in response to manipulations of the independent variable
4. Requires the use and interpretation of descriptive statistics • This is a group assignment (no more than four) • However, each student will write their own individual paper using the group’s data • Students are NOT to help each other write the report • Just use the same data • Multiple groups can do the same topic • Step 1: Organize into groups • Step 2: Choose a topic • For possible topics, please refer to handout • Students should obtain a copy of the full study via the internet and read it through carefully • Turn in topic selected to Mr. Woodside (Paper with group member names and topic) • Step 3: Obtain a copy of the actual research study • Step 4: Identify the Independent Variable • Step 5:Identify the Dependent Variable
Independent Variable vs. Dependent Variable • A good way to remember which is which: • Independent Variable (IV) = stimulus or cause (Noise or no noise) • Dependent Variable (DV) = response or effect (Number of words recalled) • Both the IV and the DV must have an operational definition. That means, you must explain what each will look like and how it will be measured. • Examples: Noise (IV) could be operationalized as loud music at volume level 35 • Operationalized DV could be the number of words remembered from a list of 20.
Internal Assessment • Step 6: Identify what measures of central tendency have been used in the study selected by your group • Central Tendency • A measure that tells us where the middle of a bunch of data lies • Three most common measures of central tendency are the mean, the median, and the mode • Mean:The arithmetic average of all the individual measurements in a distribution
Internal Assessment • Median:The score that divides a distribution of rank-ordered observations in half; in other words, the middle score. • Mode: the value that occurs most frequently in a set of data. • Step 7:Identify the measures of dispersion used in your group’s study • Dispersion • The distribution and measures of central tendency will not give a complete picture • Measures of dispersion are important for describing the spread of the data, or its variation around a central value • Three statistics frequently used to describe the dispersion in a study are the range, the standard deviation, and the variance
Range: The lowest score in a distribution subtracted from the highest score (most common) • One of the simplest measures of variability to calculate • Problem: • Cheryl took 7 math tests in one grading period. What is the range of her test scores? 89, 73, 84, 91, 87, 77, 94 • Solution: Ordering the test scores from least to greatest, we get: • 73, 77, 84, 87, 89, 91, 94 • highest - lowest is 94 - 73 = 21 • Answer: The range of these test scores is 21 points.
Standard Deviation: A measure of variability that describes an average distance of every score from the mean • Variance: A measure of difference or variance within two distributions • http://education-portal.com/academy/lesson/statistical-analysis.html • Step 8: Identify how the data is displayed in your group’s study
Data Pool of Subjects • Step 9: Select a pool of subjects to conduct your experiment on and conduct the experiment as soon as possible • 15-20 people • No younger than 16 • Participants should be volunteers from other classes • Use a “controlled” sample (uniform age) without confounding variables • Informed Consent: Need form that shows all expectations of participants • Must be debriefed • Step 10: Analyze the data from your experiment
Step 11: Write your report • 1,000 to 1,500 words • DOES NOT INCLUDE: • Title • Abstract • References • Data • Appendix • http://www.learner.org/series/discoveringpsychology/02/e02expand.html#
Grading • Instructor grades all reports • Externally moderated • Every sample paper sent in must be signed • Advice may be given after 1st draft but teacher does NOT make corrections • Teachers are not permitted to provide any kind of written feedback on the paper itself • The internal assessment is graded on a scale of 1-20, 20 being best • For this class, the project will be worth 200 points
Internal Assessment: Sections • Title: • Give a clear indication of what is being investigated. • A title such as, “Memory Experiment” is not sufficient. • The best method is to analyze your hypothesis and include reference to the variables you are investigating. • Student Name and Number • Course Title: IB Psychology SL • Date, Month, Year of Submission
Abstract • An abstract is a summation of the whole investigation. Therefore it must be concise, clear, and explicit, but relatively brief. A rule of thumb is between 100 and 200 words. • Summary of Aims • Summary of Methods • Summary of Results • Conclusion • Abstracts are generally the last thing written
Introduction • This is designed to do three things. • The first is to discuss the aim or purpose of your study. • Secondly, follow with a summary of the theory being investigated, and/or the study being replicated. In cases of a replicated study, you should identify and explain the study that is being replicated. • Remember to include the name(s) of researchers and the dates that the research was undertaken. • Third, you need to state the aim of the study • Aim of the study: Identification and explanation of study being replicated
Candidates should use this section to justify the prediction that they are making in their research hypothesis. (HL) • This section goes from broad concepts to more specific studies that are directly related to the current study. (HL) • Be sure to define all important terms in this section that are relevant to your study. • This section should end with a clearly defined aim. (refer to handout) • Follow this order: • A general introduction to the psychological subject area under investigation. Include an indication of the perspective discussed. • A summary of the key theories and research studies. This must include proper references, for example, Zajonc (1965)
Simply summarize the aim, procedure and findings of the study that you are replicating. • A rationale and justification for the study • The aim: • A statement about what is being investigated and what is expected. • It is less precise than an operational hypothesis, for example: • The aim of this study is to investigate how the use of category headings affects the number of words students at Nogales High School can recall. • Hint: • A poorly written aim: “I will replicate Loftus’s study.” Usually good introductions had aims that were stated by clearly indicating the independent and dependent variables.
Method • The only section in the report that will have subheadings!!!!! • Design: Type and justification of experimental method, explain and justify why this method and design were chosen, controls, ethical considerations, identification of independent and dependent variables • Participants: Characteristics of target population (age range, total number used & numbers of each sex any group similarities, method used in selections, how allocated to groups (random) • Materials: Written list of materials used (what is used not how) not basic materials, reference to copies in appendices, standardized instructions & debriefing & consent form • Procedures: Itemized in sufficient detail to allow full replication, chronological order, consent form, standardized instructions, did you run your study in groups or individually, debriefing
Hints Design: • Must be an ethical study and include a clear sample of the consent form. • Must address relevant ethical considerations in the main body of the report • Independent and dependent variables must be clearly stated and operationalized. • Hints Participants: • Past students failed to explain how their sample was selected and few included justification for this choice. Be sure to know the difference between a target population and a sample. • Lack of knowledge of sampling techniques was apparent in some cases. There were claims that random sampling was used when this clearly was not the case.
Hints Procedures: • Well-written procedures included clearly written standardized instructions and debriefing notes. • However, some candidates provided a simple list of steps or incomplete information. • For instance, some candidates neglected to present in their appendices the lists of words they had used in their replication of the Stroop effect study.
Results • The purpose of this section is to make clear to the reader what your raw data has revealed in support of or in opposition to your Aim. • The results section has two subsections: • 1. A written description and interpretation of results, including the use of descriptive statistics (mean, median, mode & standard deviation). • 2. Graphs /tables indicating what the results indicate. • All tables and graphs must have an appropriate heading or title (may be computer generated). • Graphs must have both axes labeled. Do not produce graphs showing each individual’s score. • Graphs or tables should be summaries of grouped data to illustrate an overall trend.
Must supply written support in your text. Graphs/tables should enhance the reader’s understanding. Tables may include mean scores or frequencies of behavior. • Description of Results: Do not include raw data (this goes in the appendix) • Use text to communicate your data along with numerical reference • Example: The mean number of words recalled by the experimental group (x1) was 2.5 (x1=2.5) and n refers to the number of participants (n=25)
Hints Results: • Overall, a general weakness of most results sections is a lack of clarity and accuracy in the presentation of the results. • See Handout • Examples: • The results are not always reported in a way that reflected the aim of the study. • Many reports only briefly stated the results without any narrative description. • Moreover, the figures and tables were not always clearly presented due to inexact or incomplete labeling.
Discussion • Discussion of results • Linking results to study being replicated • Identification of strengths and limitations of the methodology. • You might identify any factors that influenced your final outcome, especially those that were out of your control. • After identifying problems, you should suggest ways to remedy them for future research. Many times, even though your research supported the hypothesis, the methodology may have included flaws that led to this result. • Suggestions for modification and further research that may clarify the issue.
During the course of the experiment, candidates may come across unusual results or related topics that may be interesting to them experimentally. Candidates should make special note of any such thoughts that arose during the study. • Finally, a brief conclusion should be presented which summarizes the results of the experiment. • Hints Discussion: • A general weakness was a lack of depth in the discussion of the results. Candidates seem to have a problem in justifying why their own particular results occurred in the way they did. • In many cases candidates did not relate their findings to the original experiment presented in the introduction. Few candidates clearly compared their results to that of the original study. • Some made statements such as “results were similar to those found in the original study,” or that “the hypothesis was found to be true.” • While weaknesses were generally well covered, fewer candidates successfully identified the strengths of their study. • Suggestions for future research were offered but these were often of a superficial nature.
References • Works cited within the report • You must give details of all references used in your report. The preferred method is the APA Style. • Any works cited in the report or quotation used must be referenced here. • References must be alphabetical by author in the following format: Author’s last name, first initial, (year of publication). Title of Publication. Place of Publication: Name of Publisher. • DO NOT NUMBER!
Appendices • This includes all information that was inappropriate for the body of the report, but that helps the reader interpret your work. • Supplementary information (raw data in tables) • One copy of instrument(s) used • Blank copies of standardized instructions and debriefing notes • Informed Consent Form • Appendices are numbered consecutively, using lower case Roman numerals
All the Steps • Step 1: Organize into groups • Step 2: Choose a topic • Step 3: Identify the Independent Variable • Step 4: Identify the Dependent Variable • Step 5: Identify what measures of central tendency have been used in the study selected by your group • Step 6: Identify the measures of dispersion used in your group’s study • Step 7: Identify how the data is displayed in your group’s study • Step 8: Select a pool of subjects to conduct your experiment on and conduct the experiment as soon as possible • Step 9: Analyze the data from your experiment • Step 10: Write your report