Download
1 / 16
160 likes | 278 Vues
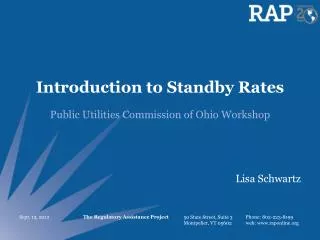
Electric Rates and Standby Charges. Presented by: Cheryl Eakle – KPPC Jason Volz – Harshaw Trane August 13, 2014. Kentucky Electric Utilities. Typical Non-Residential Rates. General Service (demand <50 kW) Commercial Power Service (50kW < demand) Industrial Time-of-Day

E N D
Electric Rates and Standby Charges Presented by: Cheryl Eakle – KPPC Jason Volz – Harshaw Trane August 13, 2014
Typical Non-Residential Rates • General Service (demand <50 kW) • Commercial • Power Service (50kW < demand) • Industrial Time-of-Day • Transmission Service
Energy Units – Electric Service • kWh = unit used to measure electric consumption (1 kW used for 1 hour) • kW = unit used to measure electric demand • Usually calculated in 15 or 30 minute intervals • Peak Demand = greatest value over the interval
Effective Cost or “All-in Cost” Total Electric Bill ($) Total Electric Use (kWh)
Effective Cost or “All-in Cost” Time-of Day Energy Charge $0.037kWh Total Electric Charges $11,748.77 Total Energy Used 144,640 kWh All-in Cost $0.081/kWh
More on Electric Demand Demand Ratchet – billing mechanism selects highest demand from the current or previous months Example – 85% of the highest demand recorded in previous 11 months
Ratchet Clause Example 85% of Peak Demand
Demand Profile Prior to CHP • 2 MW Max Load occurs during peak period • ~1 MW Base Load • 33,300 kWh daily • 365 day operation T.O.D. Energy Rates Peak Demand - $6.11/kW Intermediate Demand - $4.51/kW Base Demand - $4.00/kW Energy Charge - $0.0399/kWh Annual Energy Costs $350,880 – Demand Cost $484,965 – Energy Cost $835,845 – Total Cost Intermediate Period Base Period Peak Period
Demand Profile After CHP • 1 MW Base Load Generator used for CHP • 24,000 kWh produced by CHP generator • Generator fuel and maintenance cost - $0.043/kWh Annual Energy Costs $175,440 – Utility Demand Cost $135,441 – Utility Energy Cost $375,448 – Generator Fuel and Operation Costs $686,328 – Total Cost $149,516 – Total Energy Savings Annual Standby Costs $12.86/kW – Standby Rate $154,320 – Standby Costs for 1 MW ($4,804) –Savings after standby charges Base Period Intermediate Period Peak Period
Unplanned CHP Outage Base Period • CHP Generator trips at 9 AM. It is not restored for 24 hours Annual Energy Costs $212,060 – Utility Demand Cost $136,769 – Utility Energy Cost $374,419 – Generator Fuel and Operation Costs $723,248 – Total Cost $112,596 – Total Energy Savings Annual Standby Costs $12.86/kW – Standby Rate $308,640 – Standby Costs for 2 MW ($196,044) –Savings after standby charges Intermediate Period Unplanned CHP Outage Peak Period