Download
1 / 21
210 likes | 229 Vues
This project explores the effects of homelessness and mental health on safety, security, and property damage within Santa Monica's transit system, the Big Blue Bus. It includes data analysis, community service information, and findings on the declining ridership. Recommendations and city contacts for collaborative solutions are also provided.

E N D
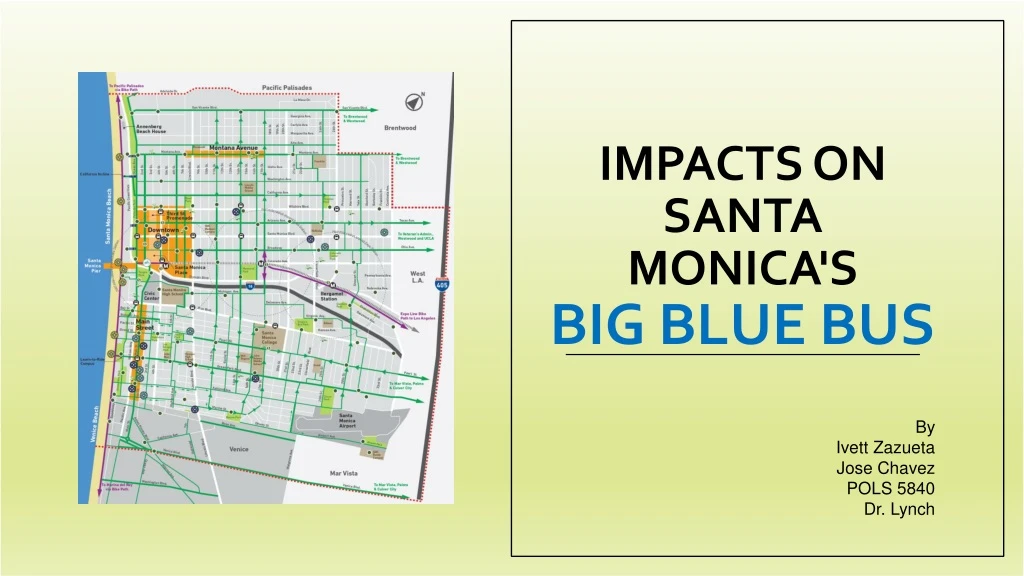
Impacts onSanta Monica'sBIG BLUE BUS By • Ivett Zazueta Jose Chavez • POLS 5840 • Dr. Lynch
BACKGROUND City of Santa Monica • 2016 Population 92,000 • Median Household Income (2015) $76k • Income Per Capita (2105) $59k • Big Blue Bus • Since 1928 • Approx. 15 million riders per year • 200 vehicles • 51 Sq. mile service area
Initial Project • Data review on how homelessness and the mental health population affect the safety, security, and property damage • Literary review on best practices to address transient population Project’s Direction Shift • Data review on safety, security, and property damage • Literary review on best practices to address transient population
ISSUES • Santa Monica • 26% increase in homeless population since last year • Big Blue Bus • Ridership has decreased about 12% as of March 2017 The decline is believed to be caused by the homeless/mental health population
COMMUNITY SERVICES • Local organizations • Various services specific groups • 211 24hr Hotline • Connects people to basic needs • Santa Monica Homeless Count • Largest proactive measure
Categorical Incident Index Table Chart Dataset sample
Data analyses Continued: Incident area chart • Most incidents do not occur • 80% hike
Data analysescontinued DAILY INCIDENT APPROXIMATE • 44% • 75% • -2%
Data analysesCONTINUED Cluster column chart • from 1:00 to 5:00 pm
Data analyses continued AM PM
INTERVIEWS • Motor Coach Operator • 40% of riders do not pay their fare • Potential external factors • Metro extension of Expo Line • Increased Uber/Lyft ridership • File incident report if necessary
FINDINGS • The transient population may not be the problem • Homeless/Mental illness individuals are not easily identified • External Factors • Several competitions in ridership market • Uber/Lyft • Expo line • Bicycles
CONCERNS • Proposition HHH • City initiative increased of sales tax • $1.2 billion for permanent supportive housing • Measure H • County initiative increased of property tax • $355 million dedicated to supportive services
GROUP DYNAMIC • Frequent communication through various forms • Open floor • 1st meeting, introduces, divided tasks, appointed Cameron as primary contact person • Adaptive to new shifts and necessary changes • Collaborative and supportive
References Elijah Chiland, “Homeless population in Santa Monica is up 26 percent,” Curbed Los Angeles, May 9, 2017, https://la.curbed.com/2017/5/9/15601342/santa-monica-homeless-population-increase. Community and Cultural Services. Information Item: Local Homeless Efforts in a Regional Context. Santa Monica, CA: Karen Ginsberg, Director of Community and Cultural Services, 2017. Anonymous interviews with the homeless community Amelia Taylor-Hochberg, “How Metro is responding to LA’s homelessness crisis,” Curbed Los Angeles, September 20, 2017, https://la.curbed.com/2017/9/20/16327770/la-metro-homeless- services. Katie Cagle, “Big Blue Bus ridership down 12% despite mass transit push,” Santa Monica Daily Press, March 3, 2017, http://smdp.com/big-blue-bus-ridership-down-12-despite-mass-transit- push/159976.