QCD@LHC 2011
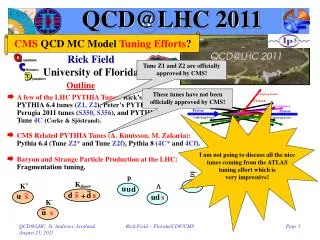
QCD@LHC 2011. CMS QCD MC Model Tuning Efforts ?. Rick Field University of Florida. Tune Z1 and Z2 are officially approved by CMS!. Outline. These tunes have not been officially approved by CMS!.

QCD@LHC 2011
E N D
Presentation Transcript
QCD@LHC 2011 CMS QCD MC Model Tuning Efforts? Rick Field University of Florida Tune Z1 and Z2 are officially approved by CMS! Outline These tunes have not been officially approved by CMS! • A few of the LHC PYTHIA Tunes:Rick’s CMS PYTHIA 6.4 tunes (Z1, Z2), Peter’s PYTHIA 6.4 Perugia 2011 tunes (S350, S356), and PYTHIA 8 Tune 4C (Corke & Sjöstrand). I am not going to discuss all the nice tunes coming from the ATLAS tuning effort which is very impressive! • CMS Related PYTHIA Tunes (A. Knutsson, M. Zakaria):Pythia 6.4 (Tune Z2* and Tune Z2f), Pythia 8 (4C* and 4Cf). • Baryon and Strange Particle Production at the LHC: Fragmentation tuning. CMS Rick Field – Florida/CDF/CMS
PYTHIA Tune Z1 • All my previous tunes (A, DW, DWT, D6, D6T, CW, X1, and X2) were PYTHIA 6.4 tunes using the old Q2-ordered parton showers and the old MPI model (really 6.2 tunes)! PARP(90) PARP(82) Color • I believe that it is time to move to PYTHIA 6.4 (pT-ordered parton showers and new MPI model)! Connections Diffraction • Tune Z1: I started with the parameters of ATLAS Tune AMBT1, but I changed LO* to CTEQ5L and I varied PARP(82) and PARP(90) to get a very good fit of the CMS UE data at 900 GeV and 7 TeV. • The ATLAS Tune AMBT1 was designed to fit the inelastic data for Nchg ≥ 6 and to fit the PTmax UE data with PTmax > 10 GeV/c. Tune AMBT1 is primarily a min-bias tune, while Tune Z1 is a UE tune! UE&MB@CMS Rick Field – Florida/CDF/CMS
PYTHIA Tune Z1 Parameters not shown are the PYTHIA 6.4 defaults! Rick Field – Florida/CDF/CMS
PYTHIA 6.2 Tunes UE Parameters Uses CTEQ6L Reduce PARP(82) by factor of 1.8/1.9 = 0.95 Everything else the same! ISR Parameter Tune A energy dependence! (not the default) Intrinsic KT CMS: We wanted a CTEQ6L version of Tune Z1 in a hurry! Rick Field – Florida/CDF/CMS
PYTHIA Tune Z2 My guess! Reduce PARP(82) by factor of 1.83/1.93 = 0.95 Everything else the same! Rick Field – Florida/CDF/CMS
PYTHIA Tune Z2 My guess! Reduce PARP(82) by factor of 1.83/1.93 = 0.95 Everything else the same! PARP(90) same For Z1 and Z2! Rick Field – Florida/CDF/CMS
PYTHIA 8 Tunes R. Corke and T. Sjöstrand CTEQ6L MRST LO** CTEQ6L PT0 = PARP(82) e = PARP(90) Tevatron LHC pT0(W)=pT0(W/W0)e e = PARP(90) pT0 = PARP(82) W = Ecm Rick Field – Florida/CDF/CMS
CMS UE Data CMS CMS Tune Z1 Tune Z1 • CMS preliminary data at 900 GeV and 7 TeV on the “transverse” charged PTsum density, dPT/dhdf, as defined by the leading charged particle jet (chgjet#1) for charged particles with pT > 0.5 GeV/c and |h| < 2.0. The data are corrected and compared with PYTHIA Tune Z1 at the generator level. • CMS preliminary data at 900 GeV and 7 TeV on the “transverse” charged particle density, dN/dhdf, as defined by the leading charged particle jet (chgjet#1) for charged particles with pT > 0.5 GeV/c and |h| < 2.0. The data are corrected and compared with PYTHIA Tune Z1 at the generator level. CMS corrected data! CMS corrected data! Very nice agreement! Rick Field – Florida/CDF/CMS
CMS-ATLAS UE Data CMS: Chgjet#1 Tune Z1 Tune Z1 ATLAS: PTmax • CMS preliminary data at 7 TeV on the “transverse” charged particle density, dN/dhdf, as defined by the leading charged particle jet (chgjet#1) for charged particles with pT > 0.5 GeV/c and |h| < 2.0 together with the ATLAS published data at 7 TeV on the “transverse” charged particle density, dN/dhdf, as defined by the leading charged particle (PTmax) for charged particles with pT > 0.5 GeV/c and |h| < 2.5 The data are corrected and compared with PYTHIA Tune Z1 at the generator level. Amazing agreement! Rick Field – Florida/CDF/CMS
PYTHIA 6.4 Tune Z2 Tune Z2 Tune Z2 • CMS preliminary data at 900 GeV and 7 TeV on the “transverse” charged PTsum density, dPT/dhdf, as defined by the leading charged particle jet (chgjet#1) for charged particles with pT > 0.5 GeV/c and |h| < 2.0. The data are corrected and compared with PYTHIA Tune Z2 at the generator level. • CMS preliminary data at 900 GeV and 7 TeV on the “transverse” charged particle density, dN/dhdf, as defined by the leading charged particle jet (chgjet#1) for charged particles with pT > 0.5 GeV/c and |h| < 2.0. The data are corrected and compared with PYTHIA Tune Z2 at the generator level. CMS corrected data! CMS corrected data! Not good! Bad energy dependence! Rick Field – Florida/CDF/CMS
PYTHIA 8 Tune C4 PY8 Tune C4 PY8 Tune C4 • CMS preliminary data at 900 GeV and 7 TeV on the “transverse” charged PTsum density, dPT/dhdf, as defined by the leading charged particle jet (chgjet#1) for charged particles with pT > 0.5 GeV/c and |h| < 2.0. The data are corrected and compared with PYTHIA 8 Tune C4 at the generator level. • CMS preliminary data at 900 GeV and 7 TeV on the “transverse” charged particle density, dN/dhdf, as defined by the leading charged particle jet (chgjet#1) for charged particles with pT > 0.5 GeV/c and |h| < 2.0. The data are corrected and compared with PYTHIA 8 Tune C4 at the generator level. CMS corrected data! CMS corrected data! Not good! PTsum too small! Rick Field – Florida/CDF/CMS
Energy Dependence CTEQ6L: PARP(90) = 0.19 CTEQ5L: PARP(90) =0.275 CTEQ6L: PARP(90) =0.275 • CMS data on the energy dependence (7 TeV divided by 900 GeV) of the “transverse” charged PTsum density as defined by the leading charged particle jet (chgjet#1) for charged particles with pT > 0.5 GeV/c and |h| < 2.0 compared with PYTHIA Tune Z1, Z2, and PY8C4 at the generator level. • CMS data on the energy dependence (7 TeV divided by 900 GeV) of the “transverse” charged particle density as defined by the leading charged particle jet (chgjet#1) for charged particles with pT > 0.5 GeV/c and |h| < 2.0 compared with PYTHIA Tune Z1, Z2, and PY8C4 at the generator level. CMS corrected data! CMS corrected data! Duh! The energy dependence depends on both PARP(90) and the structure function! Z1 and PY8C4 good! Z2 Bad! Rick Field – Florida/CDF/CMS
PYTHIA Tune Z2 PARP(90) much different! Rick Field – Florida/CDF/CMS
PYTHIA Tune Z2* “Transverse” Charged Particle Density CMS Tune Z2* (Professor tune, A. Knutsson & M. Zakaria) 7 TeV Big improvement at 900 GeV! 900 GeV Rick Field – Florida/CDF/CMS
PYTHIA Tune Z2* CMS GEN Group: Working on an improved Z2 tune (Tune Z2*) using the Professor (A. Knutsson & M. Zakaria). Rick Field – Florida/CDF/CMS
Other CMS Tunes PYTHIA 6.4 “Forward Tune”! Two PYTHIA tunes! Rick Field – Florida/CDF/CMS
PYTHIA 6.4.25 --------------------------------------------------------------------- 4th generation: tunes incorporating 7-TeV data --------------------------------------------------------------------- 340 AMBT1 : 1st ATLAS tune incl 7 TeV, w. LO* PDFs (2010) 341 Z1 : Retune of AMBT1 by Field w CTEQ5L PDFs (2010) 342 Z1-LEP : Retune of Z1 by Skands w CTEQ5L PDFs (2010) 343 Z2 : Retune of Z1 by Field w CTEQ6L1 PDFs (2010) 344 Z2-LEP : Retune of Z1 by Skands w CTEQ6L1 PDFs (2010) 350 Perugia 2011 : Retune of Perugia 2010 incl 7-TeV data (Mar 2011) 351 P2011 radHi : Variation with alphaS(pT/2) 352 P2011 radLo : Variation with alphaS(2pT) 353 P2011 mpiHi : Variation with more semi-hard MPI 354 P2011 noCR : Variation without color reconnections355 P2011 LO** : Perugia 2011 using MSTW LO** PDFs (Mar 2011)356 P2011 C6 : Perugia 2011 using CTEQ6L1 PDFs (Mar 2011) 357 P2011 T16 : Variation with PARP(90)=0.16 away from 7 TeV 358 P2011 T32 : Variation with PARP(90)=0.32 awat from 7 TeV 359 P2011 TeV : Perugia 2011 optimized for Tevatron (Mar 2011) 360 S Global : Schulz-Skands Global fit (Mar 2011) 361 S 7000 : Schulz-Skands at 7000 GeV (Mar 2011) 362 S 1960 : Schulz-Skands at 1960 GeV (Mar 2011) 363 S 1800 : Schulz-Skands at 1800 GeV (Mar 2011) 364 S 900 : Schulz-Skands at 900 GeV (Mar 2011) 365 S 630 : Schulz-Skands at 630 GeV (Mar 2011) ========================================================= PYTUNE Tune Z1 CTEQ5L Tune Z2 CTEQ6L Tune S350 CTEQ5L Tune S356 CTEQ6L The Perugia tunes have “improved” LEP fragmentation tuning! Rick Field – Florida/CDF/CMS
ATLAS UE Data ATLAS ATLAS • ATLAS published data at 900 GeV and 7 TeV on the “transverse” charged particle density, dN/dhdf, as defined by the leading charged particle (PTmax) for charged particles with pT > 0.5 GeV/c and |h| < 2.5. The data are corrected and compared with PYTHIA Tune Z1, Tune S350, and Tune S356 at the generator level. • ATLAS published data at 900 GeV and 7 TeV on the “transverse” charged PTsum density, dPT/dhdf, as defined by the leading charged particle (PTmax) for charged particles with pT > 0.5 GeV/c and |h| < 2.5. The data are corrected and compared with PYTHIA Tune Z1, Tune S350, and Tune S356 at the generrator level. Very similar to Tune Z2*! Very similar to Tune Z1! Tune S350 & S356 (Perugia 2011) fit the UE data at 900 GeV & 7 TeV very well! Rick Field – Florida/CDF/CMS
PY6.4 CTEQ5L Tunes Tune S350 and Tune Z1 are very similar! Rick Field – Florida/CDF/CMS
PY6.4 CTEQ6L Tunes Tune S356 and Tune Z2* are very similar! Rick Field – Florida/CDF/CMS
Baryon & Strange Particle Production at the LHC • Strange Particle Production in Proton-Proton Collisions at 900 GeV with ALICE at the LHC, arXiv:1012.3257 [hep-ex] December 18, 2010. INEL • Production of Pions, Kaons and Protons in pp Collisions at 900 GeV with ALICE at the LHC, arXiv:1101.4110 [hep-ex] January 25, 2011. INEL • Strange Particle Production in pp Collisions at 900 GeV and 7 TeV, CMS Paper: arXiv:1102.4282 [hep-ex] Feb 21, 2011, submitted to JHEP. NSD I know there are more nice results from the LHC, but this is all I can show today. Sorry! Step 1:Look at the overall particle yields (all pT). Step 2:Look at the ratios of the overall particle yields (all pT). Step 3:Look at the pT dependence of the particle yields and ratios. Rick Field – Florida/CDF/CMS
Kaon Production • CMS NSD data on the Kshort rapidity distribution at 7 TeV and 900 GeV compared with PYTHIA Tune Z1. The plot shows the average number of Kshort per NSD collision per unit Y, (1/NNSD) dN/dY. CMS INEL = NSD + SD Tune Z1 Tune Z1 • CMS NSD data on the Kshort rapidity distribution at 900 GeV and the ALICE point at Y = 0 (INEL) compared with PYTHIA Tune Z1. The ALICE point is the average number of Kshort per INEL collision per unit Y at Y = 0, (1/NINEL) dN/dY. No overall shortage of Kaons in PYTHIA Tune Z1! Rick Field – Florida/CDF/CMS
Kaon Production • ALICE INEL data on the charged kaon rapidity distribution at 900 GeV compared with PYTHIA Tune Z1. The plot shows the average number of charged kaons per INEL collision per unit Y at Y = 0, (1/NINEL) dN/dY. ALICE ALICE Tune Z1 Tune Z1 • ALICE INEL data on the charged kaon to charged pion rapidity ratio at 900 GeV compared with PYTHIA Tune Z1. No overall shortage of Kaons in PYTHIA Tune Z1! Rick Field – Florida/CDF/CMS
LEP: Kshort Spectrum S350 Perugia 2011 Theory/Data Rick Field – Florida/CDF/CMS
Lambda Production • CMS NSD data on the Lambda+AntiLambda rapidity distribution at 7 TeV and 900 GeV compared with PYTHIA Tune Z1. The plot shows the average number of particles per NSD collision per unit Y, (1/NNSD) dN/dY. CMS Factor of 1.5! CMS Tune Z1 Tune Z1 • CMS NSD data on the Lambda+AntiLambda to 2Kshort rapidity ratio at 7 TeV compared with PYTHIA Tune Z1. Oops! Not enough Lambda’s in PYTHIA Tune Z1! Rick Field – Florida/CDF/CMS
LEP: L Spectrum S350 Perugia 2011 Theory/Data Rick Field – Florida/CDF/CMS
Cascade Production • CMS NSD data on the Cascade-+AntiCascade- rapidity distribution at 7 TeV and 900 GeV compared with PYTHIA Tune Z1. The plot shows the average number of particles per NSD collision per unit Y, (1/NNSD) dN/dY. CMS CMS Factor of 2! Tune Z1 Tune Z1 • CMS data on the Cascade-+AntiCascade- to 2Kshort rapidity ratio at 7 TeV compared with PYTHIA Tune Z1. Yikes! Way too few Cascade’s in PYTHIA Tune Z1! Rick Field – Florida/CDF/CMS
LEP: X Spectrum S350 Perugia 2011 Theory/Data Rick Field – Florida/CDF/CMS
PYTHIA Fragmentation Parameters Warning! This may cause problems fitting the LEP data. If so we must understand why! We do not want one tune for e+e- and another one for hadron-hadron collisions! • PARJ(1) : (D = 0.10) is P(qq)/P(q), the suppression of diquark-antidiquark pair production in the colour field, compared with quark–antiquark production. Notation: PARJ(1) = qq/q Can we increase the overall rate of strange baryons by varying a few fragmentation parameters? For now ignore e+e-! • PARJ(2) : (D = 0.30) is P(s)/P(u), the suppression of s quark pair production in the field compared with u or d pair production. Notation: PARJ(2) = s/u. • PARJ(3) : (D = 0.4) is (P(us)/P(ud))/(P(s)/P(u)), the extra suppression of strange diquark production compared with the normal suppression of strange quarks. Notation: PARJ(3) = us/u . This work is in progress! Rick Field – Florida/CDF/CMS
PYTHIA Fragmentation Parameters • PYTHIA Tune Z1C: Same as Tune Z1 except qq/q is increased 0.1 → 0.12 and us/s is increased from 0.4 → 0.8. Rick Field – Florida/CDF/CMS
Kaon Production • CMS NSD data on the Kshort rapidity distribution at 7 TeV and 900 GeV compared with PYTHIA Tune Z1. The plot shows the average number of Kshort per NSD collision per unit Y, (1/NNSD) dN/dY. CMS CMS Tune Z1C Tune Z1 • CMS dNSD ata on the Kshort rapidity distribution at 7 TeV and 900 GeV compared with PYTHIA Tune Z1C. The plot shows the average number of Kshort per NSD collision per unit Y, (1/NNSD) dN/dY. For Kaon production Tune Z1 and Z1C are almost identical! Rick Field – Florida/CDF/CMS
Lambda Production • CMS NSD data on the Lambda+AntiLambda rapidity distribution at 7 TeV and 900 GeV compared with PYTHIA Tune Z1. The plot shows the average number of particles per NSD collision per unit Y, (1/NNSD) dN/dY. CMS Tune Z1C CMS Tune Z1 • CMS NSD data on the Lambda+AntiLambda rapidity distribution at 7 TeV and 900 GeV compared with PYTHIA Tune Z1. The plot shows the average number of particles per NSD collision per unit Y, (1/NNSD) dN/dY. Not bad! Many more Lambda’s in PYTHIA Tune Z1C! Rick Field – Florida/CDF/CMS
Cascade Production • CMS NSD data on the Cascade-+AntiCascade- rapidity distribution at 7 TeV and 900 GeV compared with PYTHIA Tune Z1. The plot shows the average number of particles per NSD collision per unit Y, (1/NNSD) dN/dY. CMS CMS Tune Z1C Tune Z1 • CMS NSD data on the Cascade-+AntiCascade- rapidity distribution at 7 TeV and 900 GeV compared with PYTHIA Tune Z1. The plot shows the average number of particles per NSD collision per unit Y, (1/NNSD) dN/dY. Wow! PYTHIA Tune Z1C looks very nice here! Rick Field – Florida/CDF/CMS
Transverse Momentum Distributions • CMS NSD data on the Kshort transverse momentum distribution at 7 TeV compared with PYTHIA Tune Z1 & Z1C. The plot shows the average number of particles per NSD collision per unit pT, (1/NNSD) dN/dpT for |Y| < 2. • CMS NSD data on the Lambda+AntiLambda transverse momentum distribution at 7 TeV compared with PYTHIA Tune Z1 & Z1C. The plot shows the average number of particles per NSD collision per unit pT, (1/NNSD) dN/dpT for |Y| < 2. PYTHIA Tune Z1 & Z1C are a bit off on the pT dependence! Rick Field – Florida/CDF/CMS
Transverse Momentum Distributions • CMS NSD data on the Cascade-+AntiCascade- transverse momentum distribution at 7 TeV compared with PYTHIA Tune Z1 & Z1C. The plot shows the average number of particles per NSD collision per unit pT, (1/NNSD) dN/dpT for |Y| < 2. • CMS NSD data on the Cascade-+AntiCascade- transverse momentum distribution at 7 TeV (normalized to 1) compared with PYTHIA Tune Z1 & Z1C. PYTHIA Tune Z1 & Z1C are a bit off on the pT dependence! Rick Field – Florida/CDF/CMS
Particle Ratios versus PT • CMS NSD data on the Lambda+AntiLambda to 2Kshort ratio versus pT at 7 TeV (|Y| < 2) compared with PYTHIA Tune Z1 & Z1C. • ALICE INEL data on the Lambda+AntiLambda to 2Kshort ratio versus pT at 900 GeV (|Y| < 0.75) compared with PYTHIA Tune Z1 & Z1C. Tune Z1C is not too bad but a bit off on the pT dependence! Rick Field – Florida/CDF/CMS
Particle Ratios versus PT • CMS NSD data on the Cascade-+AntiCascade- to Lambda+AntiLambda ratio versus pT at 7 TeV (|Y| < 2) compared with PYTHIA Tune Z1 & Z1C. • CMS NSD data on the Cascade-+AntiCascade- to 2Kshort ratio versus pT at 7 TeV (|Y| < 2) compared with PYTHIA Tune Z1 & Z1C. Tune Z1C is not too bad but a bit off on the pT dependence! Rick Field – Florida/CDF/CMS
Particle Ratios versus PT Tails of the pT distribution. Way off due to the wrong pT! • ALICE INEL data on the charged kaon to charged pion rapidity ratio at 900 GeV compared with PYTHIA Tune Z1. • ALICE INEL data on the charged kaons to charged pions ratio versus pT at 900 GeV (|Y| < 0.75) compared with PYTHIA Tune Z1 & Z1C. Tune Z1C is not too bad but a way off on the pT dependence! Rick Field – Florida/CDF/CMS
Particle Ratios versus PT Tails of the pT distribution. Way off due to the wrong pT! • ALICE INEL data on the Proton+AntiProton to charged pions ratio versus pT at 900 GeV (|Y| < 0.75) compared with PYTHIA Tune Z1 & Z1C. • ALICE INEL data on the Proton+AntiProton to charged pion rapidity ratio at 900 GeV compared with PYTHIA Tune Z1 & Z1C. Tune Z1C is not too bad but way off on the pT dependence! Rick Field – Florida/CDF/CMS
LEP: Proton Spectrum S350 Perugia 2011 Theory/Data Rick Field – Florida/CDF/CMS
Sherpa versus PYTHIA Kshort Production at STAR • Before making any conclusion about e+e- versus pp collisions one must check the predictions of Herwig++ and Sherpa! Strange particle production in pp at 200 GeV (STAR_2006_S6860818) Too many Kshort in Sherpa? Sherpa and PYTHIA not the same! Hendrik Hoeth http://users.hepforge.org/~hoeth/STAR_2006_S6860818/ Rick Field – Florida/CDF/CMS
Sherpa versus PYTHIA L Production at STAR • Before making any conclusion about e+e- versus pp collisions one must check the predictions of Herwig++ and Sherpa! Strange particle production in pp at 200 GeV (STAR_2006_S6860818) Sherpa does better than PYTHIA 8! Hendrik Hoeth http://users.hepforge.org/~hoeth/STAR_2006_S6860818/ Rick Field – Florida/CDF/CMS
Sherpa versus PYTHIA <pT> versus Mass • Before making any conclusion about e+e- versus pp collisions one must check the predictions of Herwig++ and Sherpa! Strange particle production in pp at 200 GeV (STAR_2006_S6860818) Sherpa does better than PYTHIA 8! Hendrik Hoeth http://users.hepforge.org/~hoeth/STAR_2006_S6860818/ Rick Field – Florida/CDF/CMS
MB versus UE CMS Tune Z1 NSD = ND + DD Factor of 2! Tune Z1 • Shows the density of charged particles in the “transverse” region as a function of PTmax for charged particles (All pT, |h| < 2) at 7 TeV from PYTHIATune Z1. • CMS NSD data on the charged particle rapidity distribution at 7 TeV compared with PYTHIA Tune Z1. The plot shows the average number of charged particles per NSD collision per unit h-f, (1/NNSD) dN/dhdf. Rick Field – Florida/CDF/CMS
UE Particle Type Log Scale! Tune Z1 • Shows the density of particles in the “transverse” region as a function of PTmax for charged particles (All pT, |h| < 2) at 7 TeV from PYTHIATune Z1. • Shows the density of charged particles in the “transverse” region as a function of PTmax for charged particles (All pT, |h| < 2) at 7 TeV from PYTHIATune Z1. Rick Field – Florida/CDF/CMS
MB versus UE Factor of ~2! Tune Z1 Tune Z1 • Shows the density of Kshort particles in the “transverse” region as a function of PTmax for charged particles (All pT, |h| < 2) at 7 TeV from PYTHIATune Z1. • Shows the Kshort pseudo-rapidity distribution (all pT) at 7 TeV from PYTHIA Tune Z1. The plot shows the average number of particles per ND collision per unit h-f, (1/NND) dN/dhdf. Rick Field – Florida/CDF/CMS
MB versus UE Factor of ~2! Tune Z1 Tune Z1 • Shows the density of P+antiP particles in the “transverse” region as a function of PTmax for charged particles (All pT, |h| < 2) at 7 TeV from PYTHIATune Z1. • Shows the P+antiP pseudo-rapidity distribution (all pT) at 7 TeV from PYTHIA Tune Z1. The plot shows the average number of particles per ND collision per unit h-f, (1/NND) dN/dhdf. Rick Field – Florida/CDF/CMS
MB versus UE Factor of ~2! Tune Z1 Tune Z1 • Shows the density of L+antiL particles in the “transverse” region as a function of PTmax for charged particles (All pT, |h| < 2) at 7 TeV from PYTHIATune Z1. • Shows the L+antiL pseudo-rapidity distribution (all pT) at 7 TeV from PYTHIA Tune Z1. The plot shows the average number of particles per ND collision per unit h-f, (1/NND) dN/dhdf. Rick Field – Florida/CDF/CMS
MB versus UE Coming soon! Measurements from CMS, ATLAS, and ALICE on the strange particles and baryons in the “underlying event”. Factor of ~2! Tune Z1 Tune Z1 • Shows the density of L+antiL particles in the “transverse” region as a function of PTmax for charged particles (All pT, |h| < 2) at 7 TeV from PYTHIATune Z1. • Shows the L+antiL pseudo-rapidity distribution (all pT) at 7 TeV from PYTHIA Tune Z1. The plot shows the average number of particles per ND collision per unit h-f, (1/NND) dN/dhdf. Rick Field – Florida/CDF/CMS
Fragmentation Summary Warning! The Tune Z1C fragmentation parameters may cause problems fitting the LEP data. If so we must understand why! We do not want one tune for e+e- and another one for hadron-hadron collisions! • Not too hard to get the overall yields of baryons and strange particles roughly right at 900 GeV and 7 TeV. Tune Z1C does a fairly good job with the overall particle yields at 900 GeV and 7 TeV. • PT Distributions: PYTHIA does not describe correctly the pT distributions of heavy particles (MC softer than the data). None of the fragmentation parameters I have looked at changes the pT distributions. Hence, if one looks at particle ratios at large pT you can see big discrepancies between data and MC (out in the tails of the distributions)! • ATLAS Tuning Effort: Fragmentation flavor tuning at the one of the four stages. • Herwig++ & Sherpa: Before making any conclusions about fragmentation one must check the predictions of Herwig++ and Sherpa carefully! Rick Field – Florida/CDF/CMS