Download
1 / 10
100 likes | 392 Vues
Local Tax Effort Index vs. Expenditure Per Pupil Analysis of Hudson City School District to Comparative Groups. 02-09-06. About this presentation. The following slides attempt to define and analyze standardized metrics as established and generated by the Ohio Department of Education.

E N D
Local Tax Effort Indexvs.Expenditure Per Pupil Analysis ofHudson City School Districtto Comparative Groups 02-09-06
About this presentation • The following slides attempt to define and analyze standardized metrics as established and generated by the Ohio Department of Education. • It provides a basis for measuring the efficiency & local tax effort for the public school districts selected and is not designed to be the only standard of measurement.
Local Tax Effort Index - Defined • The Local Tax Effort Index is an index that tends to reflect the extent of effort residents of school districts make in support of public primary and secondary education. • This index, one of many possible measures for evaluating local effort, is calculated in the context of a resident’s ability to pay. • This index has been developed exclusively by the Ohio Department of Education and can be found at www.ode.stat.oh.us/school_finance/data/policy
Local Tax Effort Index – Calculation Defined (4-step process) • Step 1: calculate the ratio of any school income tax plus school class 1 property taxes charged to federal adjusted gross income at the district and state level. • Step 2: divide the avg. income of district residents by the statewide avg. income • Step 3: Divide the Step 1 ratio by the Step 2 ratio to measure the effort in the context of ability to pay • Step 4: Divide the Step 3 ratio by the Step 1ratio to determine the relative effort index in the context of the state as a whole
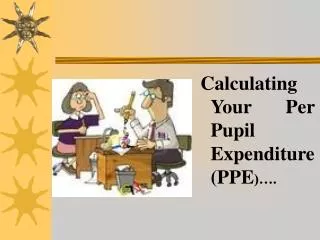
Expenditure Per Pupil Defined • To categorize and report expenses related to the education of students. • It is reported within the EFM (Expenditure Flow Model) and is the source of the Annual Spending Per Pupil numbers that appear on the Local Report Cards and the Trend Data Reports. • Not all expenditures accounted for by school districts are included in the model. • Only the expenditures from revenue generating activities are included (ie. school lunchroom).
Analysis • The following slides compare the Local Tax Effort Index to the Expenditure Per Pupil Data. The slides are sorted alphabetically by public school district and are ranked according to the following: • Local Tax Effort Index – a ranking of “1” demonstrates a larger local effort or willingness to support the local public school district. • Expenditure Per Pupil – a ranking of “1” demonstrates a larger expense per student as compared to the peer group.
Local Tax Effort Index & Expenditure Per Pupil Data of “Summit County Schools” Source: Ohio Department of Education
Local Tax Effort Index & Expenditure Per Pupil Data of “Cuyahoga County Schools” plus Hudson CSD Source: Ohio Department of Education
Local Tax Effort Index & Expenditure Per Pupil Data of “Excellent” School Districts in Northeast Ohio Source: Ohio Department of Education
Analysis results at a glance • The previous 3 slides indicate the following: • Summit County Analysis (Hudson CSD) • 2nd highest Expenditure Per Pupil • Lowest Local Tax Effort Index Score. • Note: Coventry Local has the highest LTEI at 1.62, 3-times greater than Hudson. • Cuyahoga County Analysis (Hudson CSD) • 23rd highest (out of a possible 31) Expenditure Per Pupil • 3rd Lowest Local Tax Effort Index Score • Note: Beachwood spends more per student, yet has the lowest LTEI. • Excellent School District Analysis (Hudson CSD) • 11th highest (out of a possible 17) Expenditure Per Pupil • 3rd Lowest Local Tax Effort Index Score • Note: Norton spends the least per pupil of the 17 districts, however, has the 4th highest LTEI index.