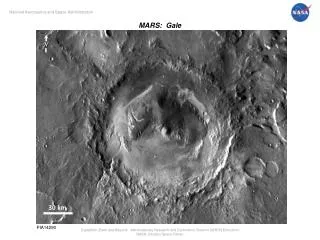
Using the Mars climate Database for aerobraking (100-150 km)
450 likes | 643 Vues
Using the Mars climate Database for aerobraking (100-150 km). François Forget Laboratoire de Météorologie Dynamique, CNRS 06/04/2011. Thermosphere parametrisation Heating and cooling : EUV heating NLTE cooling Molecular conduction Non Homogeneous atmosphere Molecular diffusion

Using the Mars climate Database for aerobraking (100-150 km)
E N D
Presentation Transcript
Using the Mars climate Database for aerobraking (100-150 km) François Forget Laboratoire de Météorologie Dynamique, CNRS 06/04/2011
Thermosphere parametrisation Heating and cooling : EUV heating NLTE cooling Molecular conduction Non Homogeneous atmosphere Molecular diffusion Photochemistry (21 reactions) Species : CO2, CO, O2,, H2 , O(3P), O(1D),, OH, H, HO2, H2O, H2O2, O3 , N2, Ar Background: LMD GCM simulation of the atmosphere thermosphere 0 – 300 km … .(F. Gonzalez-Galindo , M. Angelats I Coll, F. Forget, LMD) (see Gonzalez-Galindo et al., JGR, 2009a, 2009b, 2010) Molecular Conduction EUV IR (CO2) NIR (CO2)
Zonal mean Heating rates Ls=270° (N. winter solstice) NIR UV Cond 15 µm
Introduction: Source of variability for the upper atmosphere density • Dust storm in the lower atmosphere (impact temperature between 0 and ~60km, and thus density above) • Solar EUV variability • Atmospheric waves • Thermal tides (migrating and non migrating) • Transient waves • Gravity waves
Impact of dust storms : Mars Global surveyor aerobraking phase 1 detect a large regional storm “Noachis dust storm” Keating et al. Science 1998
Introduction: Source of variability for the upper atmosphere density • Dust storm in the lower atmosphere (impact temperature between 0 and ~60km, and thus density above) • Solar EUV variability • Atmospheric waves • Thermal tides (migrating and non migrating) • Transient waves • Gravity waves
Above ~120 km (thermosphere): Extreme UV heating varies with solar cycle (~11 years cycle, with flares) The Extreme UV Solar Radio Flux depends on the solar activity, often characterized by the 10.7cm solar radio flux, easier to measure and predict.
Introduction: Source of variability for the upper atmosphere density • Dust storm in the lower atmosphere (impact temperature between 0 and ~60km, and thus density above) • Solar EUV variability • Atmospheric waves • Thermal tides (migrating and non migrating) • Transient waves • Gravity waves
Mean characteristic of the simulated atmosphere and variability (LMD GCM)Exemple: Northern winter solstice
Very little data available between 80 and 150 km • Accelerometer data from previous aerobraking campaign (density) • CO2 density and temperature profile from UV stellar occultation using Spicam spectrometer on Mars Express.
Seasonal distribution of SPICAM stellar occultations(01/2004-03/2006) Polar night Subsolar point Polar night
Density 50°S<lat<50°N
Comparison with miniTES dust measurements from the Mars Exploration Rover Smith et al. 2006 Unusual dust loading event around Ls=130° SPIRIT OPPORTUNITY SPICAM
Density vs season z = 70km Latitude < 50° Dusty lower atmosphere: +20K Clear lower atmosphere Ls =130°
Density vs season z = 70km Latitude < 50°
SPICAM vs GCM density z = 70km Unusual dust loading GCM ? Obs
SPICAM vs GCM density z = 100km GCM Obs
SPICAM vs GCM density z = 120km GCM Obs
SPICAM vs GCM density Mean profile (S. winter)
Exploring the Mars Upper Atmosphere With Aerobraking Accelerometers
Accelerometer Density Variations at 130 km (Keating et al., 2007)
MCD: mean outputs • Mars Odyssey data
MCD: mean outputs • Mars Odyssey data
MCD: perturbed outputs • Mars Odyssey data
Analysis of orbit to orbit variabilityComparison of MCD data at fixed local time with MCD V4.3
Observations compared to MCD V3 predictions 1 (Angelats iColl et al. 2004)
Observations compared to MCD V3 predictions 2 (AngelatsiColl et al. 2004) LT = 16h and Ls ≈ 65° LT = 15h and Ls ≈ 80° LT = 15h and Ls ≈ 80° LT = 15h and Ls ≈ 80°
Migrating tides : Wave directly forced by the sun propagate westward • On Mars, the solar forcing interact with the topography and create “Non migrating tides” they can propagate eastward !
Summary : Mars main tidal modes • Definition: s is thezonal wavenumbers (s>0 westward s<0 eastward) • n is the period : n=1 is a diurnal period and n=2 is a semi-diurnal period) • Migrating tidal modes with the same phase speed as the Sun, westward • mostly s=1, n=1 (diurnal oscillation) • s=2 n=2 (semi diurnal oscillation) • Non-migrating tidal modes, with 3 major modes usually described: • n = 1 s = −1 (diurnal Kelvin wave “DK1”) • n = 1, s = −2 (diurnal Kelvin wave known as “DK2”) • n = 2, s = −1. (semi-diurnal Kelvin wave known as SK1) • Why are these eastward propagating waves so important ? • Because the atmosphere tend to resonate and amplify these waves • And because satellite on near polar orbit (~fixed local time) will mostly “see” the variability resulting from these modes with longitude.. In a fixed local time reference frame, DK1 causes wave-2 zonal variations and DK2 and SK1 cause wave-3 zonal variations. All three of these have been observed throughout the martian atmosphere.
Detailed analysis of MGS aerobraking measurements(LMD GCM, Angelats i coll et al., 2004) Local time = 4pm Observations Mars Climate database (GCM)
MGS aerobraking in-situ density simulation:Analysis of the waves involved(Angelats i Coll et al. , 2003) Wavenumber=3 Wavenumber=1 Wn = 1 + 2 +3 Wavenumber=2
Impact of small scale waves (gravity waves ?) : Mars Odyssey, orbit 199 (Ls=302°) - MCD (mean) - Mars Odyssey data
Impact of small scale waves (gravity waves ?) : Mars Odyssey, orbit 199 (Ls=302°) - MCD (perturbed with new seed) - Mars Odyssey data
Impact of small scale waves (gravity waves ?) : Mars Odyssey, orbit 199 (Ls=302°) - MCD (perturbed with new seed every 10S) - Mars Odyssey data
Some general conclusions • MCD tend to overestimate density at aerobraking altitudes • Variability of density in the aerobraking ranges (100 – 150 km) is controlled by • Impact of local, regional, and global dust storms on the thermal structure below : MCD OK ? • Variability of EUV flux on the thermospheric temperature above ~120 km: MCD ~OK • Variation with local time, longitude and latitude of thermal tides planetary waves. MCD ~OK • Forcing at the surface and in-situ • Numerous harmonics superimposed • Non polar orbit will experienced the strong diurnal density cycle (migrating tides directly forced) • Poorly known day to day variability from transient (e.g. baroclinic waves), especially near the winter pole… MCD not validated • Possibly : small scale waves . MCD with perturbation: to be validated ?
Planned improvements for Mars Climate database v5(collaboration with IAA, spain) • Improved thermal structure in the lower atmosphere… • Improved CO2 15-μm Thermal Cooling Rates • Taking into account predicted atomic Oxygen • Improved NLTE scheme • Improved Near-IR Solar Heating Rates Tuning and validation with SPICAM and aerobraking data + Ionospheric observations
~120km ~90 km ~60 km Forget et al. JGR 2009