Download
1 / 24
240 likes | 382 Vues
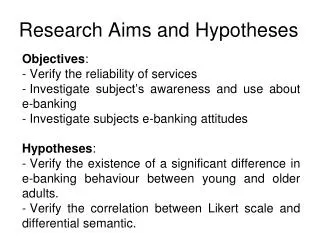
Hypotheses & Research Design. Review & Overview. You can now: concepts measurement operationalize & recode variables Describe variables: central tendency and spread Now we learn to: Formulate hypotheses Choose a proper research design Understand threats to validity.

E N D
Review & Overview • You can now: • concepts measurement • operationalize & recode variables • Describe variables: central tendency and spread • Now we learn to: • Formulate hypotheses • Choose a proper research design • Understand threats to validity
A theory is a fairly general explanation of some political phenomenon. • Theories must be testable
A hypothesis is less general than a theory. • Theories and hypotheses describe causal relationships between two or more variables.
Dependent and Independent Variables Dependent variable – what you’re trying to explain Independent variable – what we think causes the dependent variable. Independent Variable Dependent Variable Hypothesis
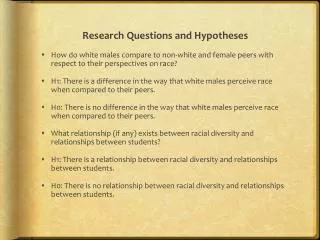
Characteristics of Hypotheses 1. Hypotheses should be as SPECIFIC as possible and provide a clear “tendency” between the variables • Example: A person’s vote is related to their annual income Better: American voters with higher income are more likely to vote Republican than are voters with lower income.
Causal Relationships and Associations For example: • Across countries per capita ice cream consumption is associated with per capital television ownership. Is this a causal relationship or an association? • Statistics can tell you if there is an association between two variables but not if that is causal.
Spurious Relationship Hypothesis expects a negative relationship, but we observe a positive one. + Number of Fire Trucks Amount of Fire Damage
Spurious Relationship Initial Reporting of Severity of Fire + + _ Number of Fire Trucks Amount of Fire Damage
Problems in Determining Causality • Reciprocal Relationships • Example:
Choosing Among Competing Theories Or Eliminating Alternative Explanations
We can never prove a theory or a hypothesis, we can only disprove.
Experimental Designs Ideal Design: • Examines a causal relationship stated in our hypothesis. • Allows us to determine if the expected association is present. • Eliminates alternative explanations.
Research Design I R Grp 1 X O1 Grp 2 O1 R= random assignment to groups X= treatment O= observation Oi= subscript on O refers to time of observation Grp 1= treatment group Grp 2= control group
Research Design II R Grp 1 O1 X O2 Grp 2 O1 O2
Research Design III Solomon 4 Group Design R Grp 1 O1 X O2 Grp 2 O1 O2 Grp 3 X O2 Grp 4 O2
Why are these designs superior to: O1 X O2 or to: X O1
Threats to Internal Validity (C&S) • History: • Other contemporaneous event(s) cause change in Y, not treatment. • Ex: Rise in DVD and game purchases. • Maturation • Natural aging/process causes change in Y. • Ex: Getting smarter or more experienced over time. • Testing: • Change in Y due to testing or pretest reactivity • Pretest may bias subsequent responses • Instrumentation: • Something happens to the observers or measurement device that causes a change in Y • Ex: fatigue, change in observers (different people)
Threats to Internal Validity (Campbell & Stanley) • Experimental Mortality • Effect is due to a differential loss in comparison groups. • Statistical Regression • Regression to the mean. Groups selected based on extreme scores will tend to display lower scores next time. • Sample Selection • Difference in comparison groups is not due to treatment, but to the fact that the groups were different from the start.
Internal Validity External Validity Are our claims concerning the effects of the treatments valid in this particular experiment? Can our results from this experiment be generalized to other populations and settings? Threats to Validity
Threats to External Validity In general, anything that makes the effects found for the experimental groups unrepresentative of effects on a larger population or in a different setting. • Generalize to a different setting: For example, are results in a lab realistic enough to apply outside the lab? • Selection: For example are the survey groups representative of the larger population, or was the original population defined too narrowly to be of real interest?
Why do properly constructed research designs eliminate other explanations? Alternative Cause 0 Treatment Result
Quasi-Experimental Designs • Typically in political science we can’t do proper experimental designs. Usually we can’t manipulate who gets the treatment and who does not. • Instead we must observe what nature presents to us. That makes it the responsibility of the research to statistically control for all variables that may affect the relationship between our dependent and our independent variable.