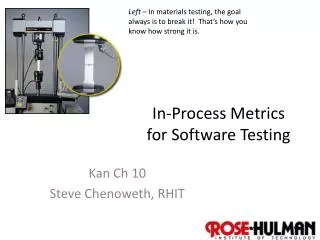
Metrics to improve software process
Metrics to improve software process. Juha Tarvainen. Contents. Preface, background, idea Ways to improve process Introduction to some of the metrics for process improvement A glimpse on the analyzing tools Improving the process Conclusions, references.

Metrics to improve software process
E N D
Presentation Transcript
Metrics to improve software process Juha Tarvainen
Contents • Preface, background, idea • Ways to improve process • Introduction to some of the metrics for process improvement • A glimpse on the analyzing tools • Improving the process • Conclusions, references
Common problems in software processes • Cost overruns • Schedule delays • Low productivity rate • Poor quality - in software, maintenance or fixes
Total Quality Management (1985) • Process: ”The objective is to reduce process variations and to achieve continous process improvement. This element includes both the business process and the product development process. Through process improvement, product quality will be enhanced”.
The usage of • Models: The waterfall development model, The prototyping approach, The spiral model, The iterative process model.. • Process Maturity framework: The SEI Capability Maturity Model (CMM, CMMI), The SPR Assesment... • Quality standards: ISO 9000 • Measurements and analysis ->Leads to need of metrics
Metrics • Metrics are measurements, collections of data about project activities, resources and deliverables. Metrics can be used to help estimate projects, measure project progress and performance, and quantify product attributes. • Software metrics can be classified into three categories: • Product metrics (size, complexity, performance) • Process metrics (used to improve development and maintenance) • Project metrics (cost, schedule, productivity)
Metrics for software process • Some of the software metrics • Productivity & efficiency metrics • Management support metrics • Size metrics (also used to create other metrics): • Lines of code (LOC) • Function points (FP)
Lines of code • Not as simple metric as it may sound • Is used in many metrics, for example in defect rate: defects per KLOC (=thousand lines of code) or LOC inspected • Many problems • The ambiguity of the counting – meaning is not the same with Assembler or high-level languages • What to count? Blank lines, comments, data definitions, only executable lines..? • Problematic for productivity studies: the amount of LOC is negatively correlated with design efficiency
Function points • Function Points measure software size by quantifying the functionality provided to the user based solely on logical design and functional specifications • Has gained acceptance in terms of productivity (for example FP/year) and quality (defects/FP) • The IFPUG counting practices committee ( http://www.ifpug.org ) is the de facto standard for counting methods
Function points • A weighted total of five major components that form an application: • Number of external inputs (e.g. transaction types)x4 • Number of external outputs (e.g. report types)x5 • Number of logical internal files (from the users’ point of view as the may be conceived, not physical files)x10 • Number of external interface files (files accessed by the application but not maintained by it)x7 • Number of external inquiries (types of online inquiries supported)x4
Function points • Can be calculated with low or high weighting factors depending the complexity assesment of the application • Many metrics can be based on function point calculations • Although FP is usually more realistic metric than LOC... • Calculating FP’s needs training • Sometimes LOC is a metric fair enough
Software metrics for process purposes • The effectiveness of defect removal in-process • The pattern of testing defect arrival • The response time of fix process • Also in-process quality metrics improve both the product and the process: • Defect density during machine testing • Phase-based defect removal pattern
Defect density during machine testing • A simple metric: defects/KLOC or defects/FP • Defect rate during formal machine testing is usually connected with the defect rate in the field • Higher defect rates found during testing indicate that the software has experienced high error injection – unless some new testing approach is used or some extra testing is used for some reason • Indicates the quality of the product when the software is still tested – many defects in testing mean that there’s too much error input in process • Can be used in other metrics
Phase-based defect removal pattern • An extension of the defect density metric • Requires the tracking of defects at all phases of the development cycle, including design, code inspections, formal verifications before testing and such • Idea: large percentage of programming defects is related to design problems – using error tracking and removal in early stage reduces error injection and improves process in the end
Defect Removal Effectiveness (DRE) DRE= A simple metric: Defects removed during a development phase x100% Defects still hidden in the product Of course the number of latent defects in the product at any given phase is not known, so the metric is based on approximation. Its usually estimated by: Defects removed during the phase + defects found later
Defect Removal Effectiveness • The metric can be calculated for the entire development process, for each phase or before code integration • The higher the value, the more effective the development process and fewer defects escaping to next phase or the field For example, calculated for spesfic phases = phase effectiveness:
About phase effectiveness • Phase defect removal effectiveness and related metrics are useful for quality management and planning • Measurements that indicate clearly which phase of the process needs improvement and should be focused on • Using the right tools, analyses can be done for the entire project as well as for local areas
The pattern of testing defect arrival • Measuring the pattern of defect arrivals (times between failures) • Objective is to look for defect arrivals that stabilize at very low level or times between failures that are very far apart before ending the testing • Indicates how the testing is done (if the patterns still occur as high level, badly) and future reliability (long times between failures indicate qood reliability)
The response time of fix process • Most organisations have established quidelines on the time limit within the fixes should be available for the reported defects • Severe problems are usually being as soon as possible, less severe has more relaxed time • The fix response time metric is usually calculated for all problems as follows: Mean time of all problems from open to closed
The response time of fix process • Sometimes there are less severe problems that customers just ignore, so the problem remains open for a long time ->distortion of mean time ->in these cases, medians should be used instead of mean time values • Idea: short time in fix process leads to customer satisfaction and determines how good the process is in this field
About productivity metrics.. • Software productivity is a complex subject concerning lots of factors (resources, quality, time..) • Metrics like LOC/hour, FP/person-month, hours / class and average person-days/class (in object metrics) etc. • Usually number of units of output per unit of effort • Can be used to increase development by focusing on certain not-efficient phases – usually problematic in other sense, too
Tools for analyzing metrics • Metrics are no use if they are not analyzed properly • For process and quality control at the project level • Some are more useful than others • Ishikawa’s 7 ”old” tools: • Checklist • Pareto Diagram • Histogram • Scatter diagram • Run chart • Control Chart • Cause-and-effect diagram
Tools for analyzing metrics • Also ”new” tools: the affinity diagram, the relations diagram, the tree diagram, the matrix chart, the matrix data analysis chart, the process decision program chart and the arrow diagram • Plenty of tools, but just using them doesn’t improve anything – careful and selective usage might do so
Software process improvement in general • Usage of model based approach, like Capability Maturity Model for Software (CMM) or Capability Maturity Model Integration (CMMI) for guiding and measuring process improvement effort • Goal should be improving process maturity instead of attaining CMMI level • Measures and analyzes are used when determining process’ qualities
Example: Using function point metrics to measure software process improvements • What kind of value results process improvements bring? • Fewer failures? • Higher productivity and quality? • Shorter schedules? • Higher user satisfaction? • Measurement with function points • First a formal process assessment and a baseline, followed by a six-stage improvement program
Using function point metrics to measure software process improvements • Software process assessment, baseline • Assesment: finding all the strengths and weaknesses associated with software • Baseline: providing a quantitative basis for quality, productivity, costs etc. -> collected with function point metrics • Stage 1: Focus on management technologies • Stage 2: Focus on Software Processes and methodologies
Using function point metrics to measure software process improvements • Stage 3: Focus on new tools and approaches • Stage 4: Focus on Infrastructure and Specialization • Stage 5: Focus on Reusability • Stage 6: Focus on Industry Leadership
Using function point metrics to measure software process improvements • As the focus has been in all the 6 stages in improvement, data is collected and metrics are used estimating the results • Function points can measure noncoding activities such as design, documentation and management, too
Using function point metrics to measure software process improvements • Imaginary values are used to demonstrate how values improve when improving the process from CMM 1 to CMM 3
Using function point metrics to measure software process improvements
For noticing.. • Almost everything can be measured, but for what purpose? • Planned metrics vs. actual metrics (for example error estimation) • Evaluation – designed and careful, objectivity needed • Software process is a complicated matter with lots of elements like creativity and mental activity. Using statistic metrics and tools doesn’t absolutely make it better, but the right usage (Goal/Question/Metric) can help to improve the process. • Improving software process is a long way depending on various factors and should be done with a model
References • Stephen H. Kan, “Metrics and Models in Software Quality Engineering”, Pearson Education Limited 2003, Boston, United States • International Function Point Users Group, http://www.ifpug.org • SPC metrics resources, http://www.spc.ca/resources/metrics/index.htm • R.S. Pressman & Associates, Inc., Software Engineering Resources, http://www.rspa.com/spi/