Download
1 / 30
300 likes | 454 Vues
8 Methods in Short-Term Climate Prediction 1.climo, 2.persist , 3.OCN , 4 . Local regress, 5 Non-local regress, 6 Composites, 7 regression at the pattern level , 8 NWP, 9 Consolidation, 10 Other methods, 11 Methods not used , App I, App II.

E N D
8 Methods in Short-Term Climate Prediction 1.climo, 2.persist, 3.OCN, 4. Local regress, 5 Non-local regress, 6 Composites, 7 regression at the pattern level, 8 NWP, 9 Consolidation, 10 Other methods, 11 Methods not used, App I, App II
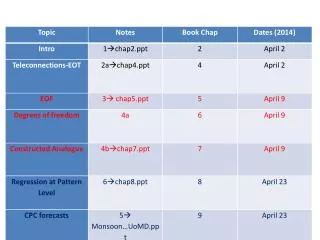
8.7 Regression at the Pattern Level Most empirical methods in short-term climate prediction are nowadays based on multiple linear regression ‘on the pattern level’. A primitive example is as follows. Suppose we have two data sets, f(s,t) called the Predictor, and g(s,t) called the Predictand. One can perform two stand alone EOF analyses of f and g, and then do the regression between the time series of the leading modes in the predictor and predictanddata sets. Klein and Walsh(1984) made an in depth comparison of regression between EOF mode time series on the one hand and regression between the original data at gridpoints on the other - this was in the context of ‘specification’ (see Ch7.3). Using modes is efficient, and cuts down on endless choices, but it may not always help the skill. Reason: stand alone EOF on f(s,t) is unaware of any relations to g(s,t) (and vice versa) For a more general approach we first discuss the (time lagged) cross-covariance matrix.
8.7.1 The time lagged covariance matrix When we have two data sets, f(s,t) called Predictor, and g(s,t) called Predictand, one can define the elements of the time lagged cross - covariance matrix Cfg as nt cij= Σf(si,t) g(sj,t+τ)/nt (8.5) 1 where nt is the number of time levels, a time mean of f and g was removed, and τis the time lag. C, non-square in general, thus contains the covariance between the predictor at any place in its domain, and the predictand anywhere in its domain. (From the time lag in g our intention is clear: to predict g from f. However, some analyses below (CCA, SVD) do not go beyond establishing associations between f and g, leaving in the middle who predicts whom. Most texts on SVD and CCA thus do not show a time lag) Associated with cij there is also a correlation ρij= nt * cij/sqrt{Σf 2(si,t) Σg 2(sj,t+ τ) } (8.5a) If g and f were the same data set, and the time lag is zero, C would be the square Q, as per Eq (2.14). Along with Cfg we also need Qf and Qg below. (Qf = Cff(τ =0)).
Given how Q was manipulated to calculate EOF one may surmise that C can be used to relate patterns&time series in the predictor field to patterns&time series in the predictand field. Indeed, C, in its various renditions depending on prefiltering, truncation, orthogonality constraints, organization of input data sets, etc, is among the most studied in short term climate prediction. Instead of the role played by the notion explained variance (EV) in EOFs, the target of calculating coupled patterns/time series is often in ‘explaining’ the co-variance between f and g. Because covariance can be negative, the target is often taken to be ‘squared covariance’ (SC). i.e. the fraction of Σcij2, where summation is over all i and j, that can be explained by 1, 2 or m coupled ‘modes’. Without any truncation or constraint C is set up to create any imaginable regression between f and g, so as to minimize the mseof the prediction of g, on the dependent data that is used to compute C. Here lies a very significant problem. With so many predictors f(s,t), it is hard to avoid overfitting. C contains the correlation of everything with everything. The danger of overfitis combated by severe truncation at the pattern level. This also reduces the subjective nature of choosing predictors.
8.7.2 CCA, SVD and EOT2 In chapter 5 we presented EOFs of the data set f(s,t) as: Mf f ( s, t) = Σαm(t) em(s) (8.6) m=1 where both the time series and spatial patterns are orthogonal. Recall Eq(8.6) still gives a complete representation of f as long as either the time series or the spatial patterns are orthogonal, and Mf is large enough. Likewise we have for the predictand: Mg g ( s, t+τ) = Σ βm(t+τ)dm(s) (8.6a) m=1 Coupling the modes among the two data sets f and g, which have the same number of time levels but possibly different spatial domains (also Mf ≠ Mg), will be discussed below in terms of the properties of αm(t) and βm(t+τ) and dm(s) and em(s) respectively. In any of the CCA, SVD or EOT2 methods orthogonalityis maintained in either time or space (not both), so the coupled modes do allow projection of future data and/or partial rebuilding of f and g themselves with a set of modes, and the notion explained variance within each data set still applies.
The plain distinguishing feature of Canonical Correlation Analysis (CCA) is that the correlation of αm(t) and βm(t+τ), denoted cor(m), is maximized - the modes are ordered such that cor(m)>cor(m+1) for all m. Within each data set we have for CCA: Σαk(t) αm(t) = 0 for k ≠ m (CCA-1) Σβk(t+τ) βm(t+τ) = 0 for k ≠ m (CCA-2) t i.e orthogonal time series, and across the data sets: Σαk(t) βm(t+τ) = 0 for k ≠m (CCA-3) Σαk(t) βm(t+τ) = cor(m) for k = m (CCA-3a) t The cor(m) can be found as the square root of the eigenvalues of the matrix M = Qf-1Cfg Qg-1CfgT (or from Qg-1CfgT Qf-1Cfg). Note that CCA’s maps are not orthogonal. Note the homogeneous and heterogeneous orthogonality properties. The modes internal to f and g are still EOTs.
On the other hand, in a method often called singular value decomposition (SVD) the explained SC is maximized. For SVD we have within each data set: ∑ ek(s) em(s) = 0 for k ≠ m (SVD-1) ∑ dk(s) dm(s) = 0 for k ≠ m (SVD-2) s i.e. orthogonal maps, and across the data sets: ∑ αk(t) βm(t+τ) = 0 for k ≠ m (SVD-3) ∑ αk(t) βm(t+τ) = σ(m) for k = m (SVD-3a) where σ(m) is the m’th singular value of Cfg. The SC explained by mode m is σ2(m). We use the name SVD, even though we agree with Zwiers and Von Storch (1999) that it is unfortunate that the name of the method is confused with a basic matrix operation; they suggest Maximum Covariance Analysis or MCA. Homogeneous and heterogeneous properties. Which EOT do we see internal to f and g?.
Notice the (dis)similarities of SVD and CCA. CCA has orthogonal time series, SVD orthogonal maps. Properties (CCA-1) and (CCA-2) vs (SVD-1) and (SVD-2) appear to be a matter of space-time reversal, but this can not be stated for the 3rdproperty, because the roles of cor(m) and σ(m) appear similar. The notion ‘SC explained’ is sometimes also used for CCA, but does not relate trivially to cor(m). Theoretically it is possible that the first CCA mode describes a perfectly coupled f-g process of infinitesimal amplitude (high cor, low SC).
Let’s try EOT2…. An easy way of explaining both the idea and the actual application of methods like CCA and SVD to a forecast situation may be to use ‘EOT2' or cross EOT, which is EOT extended to two data sets. Specifically, we seek the position s1 in space so that the time series f(s1,t) explains the most of the variance in the predictand data set g(s,t) at lag τ. I.e. we find i for which U(i) defined as U(i) = ∑ ( ρ2ij* ∑ g 2(sj,t+τ) / nt) (8.7) j t is maximum. Having found s1 we take f(s1,t) …..
Having found s1 we take f(s1,t) to be the first mode’s time series of bothf and g expansions, i.e. fexplained(s, t) = a (s1, s) f (s1, t), and gexplained(s, t+τ) = b (s1, s) f (s1, t), where a (s1, s) is the regression coefficient to predict f (s,t) from f (s1, t) and b (s1, s) is the regression coefficient to predict g (s,t+τ) from f (s1, t). The spatial patterns in (8.6) are thus: e1(s)= a (s1, s) and d1(s)= b (s1, s). The once reduced data sets is given by freduced (s, t) = f (s, t) - a (s1, s) f (s1, t), and greduced (s, t+τ) = g (s, t+τ) - b (s1, s) f (s1, t), We then seek the 2nd point in the reduced data sets. This procedure has many of the properties of CCA, specifically the identities (CCA-1), (CCA-2) and (CCA-3/3a), the latter with cor(m)=1 for all modes. (Oddly, EOT2 actually ‘beats’ CCA on producing the highest correlation between the time series.) EOT2 has at least two notions of relevance, the EV in data set f, and the EV in data set g. The latter is what is we want to maximize. There does not appear to be a particular need for the notion explained SC, after all the target of the prediction is EV in g.
The reader will not be surprised that there is an ‘alternative’ lagged covariance matrix given by caij= ∑ f(s, ti ) g(s,tj+τ) /ns (8.5b) s Here we consider inner products of maps of fields f and g at times ti and tj+τ. At first sight this definition is possible only if the domain and gridpoints for f and g are the same. However, this discrepancy is resolved by first executing EOFs on f and g individually and thinking of s in (8.5b) as the EOF mode number. We now pick the one f map at time ti which maximizes the variance explained in g, an expression similar to (8.7) but reversing the roles of time and space. This single map then acts as e1(s) for f and d1(s) for g. There are two time series, which are regression coefficients a( t1, ti) to predict f(s, ti ) from f(s, t1 ) and b( t1, ti) to predict g(s, ti +τ) from f(s, t1 ). This alternative EOT2 route leads to the expansion (8.6) and (8.6a) with the properties (SVD-1) and (SVD-2) but not(!) (SVD-3). The alternative EOT2 has again two notions of relevance, the EV in data set f, and the EV in data set g. The latter is not only what is maximized, but is the purpose of the regression.
The two EOT2 versions that closely bracket CCA (regular EOT2) and SVD (alternative EOT2) come with either 2 maps and one time series (nearest CCA) or one map and two time series (nearest SVD). From this it appears that SVD is subject to more orthogonality constraints than CCA - after all (CCA-3) follows trivially when there is only one time series to begin with, but (SVD-3) does not follow automatically from having a single map (d=e). Note that when admitting too many modes CCA/SVD/EOT2 goes in the direction of multiple linear regression. Obviously, truncation is necessary for reaping the benefits of regression at the pattern level. An important difference: EOT2 has a direction (is asymmetric), i.e. it knows that g is predicted from f. In CCA and SVD the relation is “symmetric”, leaving in the middle who is predicting whom. Much information about SVD and CCA can be found in Bretherton et al(1992), Newman and Sareshmukh(1997) and Zwiers and von Storch(1999). Wilks(1995) provides a good discussion of CCA.
Example of EOT2 Is Temperature over the US in July related to Soil Moisture at the end of May?? T ( 102 locations, 1932-2007) W (102 locations, 1932-2007)
Soil Moisture at the end of May (w) is used to ‘explain’ US Temperature (T) in July. w (s, t); s=1,102 Climate Divisions and t=1932-2007; T(s,t)
1st EOT2 2 maps, 1 time series Predictand Predictor
1st EOT2a 1 map, 2 time series
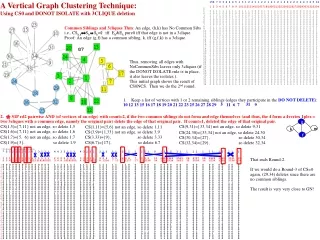
EOT-normal Q is diagonalized Qa is not diagonalized (1) is satisfied with αm orthogonal Q tells about Teleconnections Matrix Q with elements: qij=∑ f(si,t)f(sj,t) t iteration Rotation EOF Both Q and Qa Diagonalized (1) satisfied – Both αm and em orthogonal αm (em) is eigenvector of Qa(Q) Laudable goal: f(s,t)=∑ αm(t)em(s) (1) m Discrete Data set f(s,t) 1 ≤ t ≤ nt ; 1 ≤ s ≤ ns iteration Arbitrary state Rotation Iteration (as per power method) Matrix Qa with elements: qija=∑f(s,ti)f(s,tj) s EOT-alternative Q is not diagonalized Qa is diagonalized (1) is satisfied with em orthogonal Qa tells about Analogues Fig.5.6: Summary of EOT/F procedures.
EOT2 (1) and (2) satisfied αm and βm orthogonal (homo-and-heterogeneous Cff (τ=0), Cgg(τ=0) and Cfg diagonalized One time series, two maps. CCA Very close to EOT2, but two, maximally correlated, time series. Cross Cov Matrix Cfgwith elements: cij= ∑ f(si,t)g(sj,t+ τ)/nt t Laudable goals: f(s,t) = ∑ αm(t)em(s) (1) m g(s,t +τ) = ∑ βm(t +τ)dm(s) (2) m constrained by a connection between α and β and/or e and d. Discrete Data set f(s,t) 1 ≤ t ≤ nt ; 1 ≤ s ≤ ns Discrete Data set g(s,t +τ) 1 ≤ t ≤ nt ; 1 ≤ s ≤ n’s Alt Cross Cov Matrix Cafgwith elements: caij= ∑ f(s,ti)g(s,tj+ τ)/ns s SVD Somewhat like EOT2a, but two maps, and (heterogeneously) orthogonal time series. EOT2-alternative (1) and (2) satisfied em and dm orthogonal αm and βm heterogeneously orthogonal Caff (τ=0), Cagg(τ=0) and Cafg diagonalized Two time series, one map. Fig.x.y: Summary of EOT2 procedures.
EOT2 (1) and (2) satisfied αm and βm orthogonal Cff (τ=0), Cgg(τ=0) and Cfg diagonalized One time series, two maps. CCA Very close to EOT2, but two, maximally correlated, time series. Cross Cov Matrix Cfgwith elements: cij= ∑ f(si,t)g(sj,t+ τ)/nt t Laudable goals: f(s,t) = ∑ αm(t)em(s) (1) m g(s,t +τ) = ∑ βm(t +τ)dm(s) (2) m Constrained by a connection between α and β and/or e and d. Discrete Data set f(s,t) 1 ≤ t ≤ nt ; 1 ≤ s ≤ ns Discrete Data set g(s,t +τ) 1 ≤ t ≤ nt ; 1 ≤ s ≤ n’s Alt Cross Cov Matrix Cafgwith elements: caij= ∑ f(s,ti)g(s,tj+ τ)/ns s SVD Somewhat like EOT2a, but two maps, and (heterogeneously) orthogonal time series. EOT2-alternative (1) and (2) satisfied em and dm orthogonal Caff (τ=0), Cagg(τ=0) and Cafg diagonalized Two time series, one map. Fig.x.y: Summary of EOT2 procedures.
A bit of history: CCA was not used much in meteorology until Barnett and Preisendorfer(1987). The main methodological twist in their paper is a prefiltering step where both f and g are truncated to just a few EOFs before calculating C. (Moreover, the EOF associated time series are standardized, as in a version of the Mahalanobis norm (Stephenson 1997)) The prefiltering greatly reduces CCA’s susceptibility to noise. The prefiltering also makes the practical difference between SVD and CCA in many instances very small. Additionally Barnett and Preisendorfer(1987) applied their adjusted CCA to the seasonal forecast and had the predictor data set cover four antecedent seasons. This method and this particular predictor lay-out has been popularized by Barnston(1994) and his work found short-term climate prediction application on nearly all continents (Johansson et al (1998) for Europe; Thiaw et al(1999) for Africa; Hwong et al(2001) for Korea, Shabbar and Barnston(1996) for Canada, He and Barnston(1996) for tropical Pacific Islands and Barnston and Smith(1996) for the whole globe). While SVD is often mentioned in one breath with CCA, and widely used in research (Waliser et al 1999; Wu and Dickinson 2005) there appear to be far fewer real-time forecast applications based on SVD. CCA is also applied as a method to correct errors in GCM predictions (Smith and Livezey 1999; Tippett et al, 2005)
Although methodological details are hotly debated sometimes, the other choices may be more important than the exact method. For instance, which predictors, how far back in time, how many time levels, the domain for predictors and predictands, pre-filtering, truncation etc, may be more important than the exact CCA vs SVD method. The CCA at CPC and ESRL, identically the same method, often give conflicting tropical Pacific SST forecasts. While we presented the above material as a strictly separated predictor f and predictand g, keep in mind that the data sets may be combined, i.e. fields of the predictand at an earlier time may be appended to f in order to forecast g. CCA has been used at both ESRL and CDC for real time seasonal prediction; skill levels are at best (short lead JFM seasonal T&P) 0.3 - 0.35 correlation nationwide with regional variations that reflect the large impact of ENSO (Barnston 1994; Quan et al 2005). The CCA modes suggest lesser influences from other tropical areas and mid-latitude oceans as well.
8.7.3 LIM, POP and Markov Somewhat similar to CCA and SVD are the linear inverse model (LIM) and principal oscillation patterns(POP). The similarity is in the central role of the lagged covariance matrix as in (8.5), evaluated from data. However, both POP and LIM try to generalize the results for lag τto all other lags by assuming an underlying theory. Following the Winkler et al(2001) notation one may assume a linear model given by d x/dt = L x + R (8.8) where x is the retained scales state vector, L is a linear operator and R is random forcing due to unresolved scales (possibly with structure in space). Vector x would for instance be a combination of data sets f and g. The solution to (8.8) is x(t+τ) = exp(L τ) x(t) + R’, (8.9) where R’ depends on the history of R. The operator L can be determined from data at a chosen lag τ0, i.e. we evaluate C for lag τ0. L is given by C(τ0) C-1(τ =0), see Winkler et al (2001) for detail. The forecast for any lag τis given by the first term in (8.9). The forecasts for τ0would, everything else being the same, be close to CCA’s. But an analytical flavor is added because time evolution is implied. Moreover, it is possible to calculate the eigenvectors of the asymmetric L once and for all - they are structures evolving in time, and ultimately damped. By knowing the projection of the current initial state onto the known eigenvectors of L, the forecast can be made analytically and can be interrogated for diagnostic purposes, such as in deriving the optimal structure to produce an El Nino pattern 10 months later (Penland and Sardeshmukh 1995).
A straightforward method has been presented in Xue et al(2000). In this paper the discretized version of (8.8) is used: x (t+ τ) = C(τ) C-1(τ=0) x(t) , i.e. given an initial state x(t) and C(J) C-1(J=0) as determined from data, the forecast for lead J can be made. No linear model is assumed, so the calculation has to be done for each τseperately, and nothing connects the forecasts at two different τ, except to the extent the data suggest. No modes are calculated, neither eigenmodes of L (as in LIM/POP, see Eq 8.9), or M (CCA) nor singular vectors of C (as in SVD). This cuts down on interpretation. The problem is handled as multiple linear regression, however after extremely heavy truncation using extended EOF in the input data. Xue et al(2000) use sea-level height, wind stress and SST to forecast the same (sea-level height, wind stress and SST) in the tropical Pacific which appears to be a wise choice, since the methods has worked well in real time. They call their method a ‘Markov’ (MRK) method. CCA, SVD, and LIM, POP and MRK have options in truncation both in preparing the input data, and in truncating the modes calculated from C, L or M.
CCA: • Make a square M = Qf-1 Cfg Qg-1 CfgT • E-1 M E =diag ( λ1 ,λ2, λ3,… λM) • cor(m)=sqrt (λm) SVD: 1) UT Cfg V =diag (σ1 , σ2, … , σm) Explained Squared Covariance = σ2m • Assorted issues: • Prefiltering f and g , before calculating Cfg • Alternative approach complicated when domains for f and g don’t match • Iteration and rotation: CCA > EOT2-normal; SVD > EOT2-alternative ???
Keep in mind • EV (EOF/EOT) and EOT2 • Squared covariance (SC) in SVD • SVD singular vectors of C • CCA eigenvectors of M • LIM complex eigenvectors of L (close to C) • MRK no modes are calculated (of L) • And now we have Partial Linear Squares Regression