Download
1 / 17
170 likes | 303 Vues
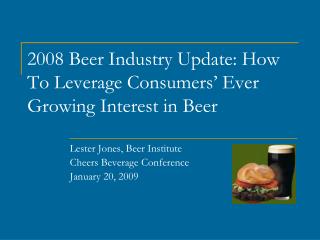
Beer Institute, Research Washington, DC Draft Beer Industry Update, 2011. Lester Jones Chief Economist Beer Institute, Washington, DC. Measuring the Malt Beverage Industry (brewers/importers -- distributors-- retailers -- consumers). Draft Beer Market. In 2010…

E N D
Beer Institute, Research Washington, DC Draft Beer Industry Update, 2011 Lester Jones Chief Economist Beer Institute, Washington, DC
Measuring the Malt Beverage Industry(brewers/importers -- distributors-- retailers -- consumers)
Draft Beer Market • In 2010… • US brewers produced 556.8 million gallons of draft • importers brought 68.5 million gallons of draft • total draft industry was 625.3 million gallons • From 2009 to 2010… • Share of draft grew from 9.5% 2009 to 9.7% in 2010 • 1 out of 10 beers consumed in the US is a draft beer • Total draft volumes grew +1.1% while overall industry declined • Flow rate of 1 min/gallon and 625.3 million gallons • 10.4 million hrs. -- 434,268 days -- 1,190 years to flow! • If all 2010 volumes went through 1 keg, it would flow until the year 3201!
Structure of Industry 1980-2010 Source: Beer Institute, Brewers Association, Commerce Department, and TTB, 2011
Per Capita Consumption of Malt Beverages1980 to 2010 (total gallons/total population) • 24.6 in 1981 20.6 in 2010 • Demographics (baby boomer-millenniums ) • Increased alcohol beverage competition • Increased non-alcohol beverage competition • Policy Changes (21 LDA and .08) Source: Beer Institute, 2011
Total Industry Supply(Domestic Tax Paid + Imports) 7-8 million barrels off peak from early 1990s (248 million gallons) Source: Beer Institute, Commerce Department, and TTB, 2011
Gallup Poll, 1992-2011 Beer faces challenge as the preferred beverage of choice for US consumers . (666 respondents with 5 pts +/- margin of error) 36% v 35% The 18-34 year old group dropped from 51% in 2010 to 39% in 2011. For people with incomes less than $30K, 51% are reported beer drinkers. Source: Gallup Poll, 2011: Do you most often drink beer, wine, or liquor?
2010 Wine, Liquor and BeerVolume Share and Growth Trends By Price Tiers Opportunity for beer to continue to grow in high end. Continued growth for crafts, imports and specialties. Industry would need to add 15-20 million barrels into high end to match wine and spirits share distribution. Source: Beer Institute, 2011(Beer Marketers Insights, Discus, Beverage Information Group)
Industry SupplyAug YTD 2010 vs. Aug YTD 2011 Eight months of data show a shift in share to imports with imports growing +1.9% vs. -2.6% for domestics.. Source: Beer Institute, Commerce Department and TTB, 2011
Industry Supply – Package MixAug YTD 2010 vs. Aug YTD 2011 Eight months of data show a shift in share to imports with imports growing +1.9% vs. -2.6% for domestics. This year, draft is fairing much better than packaged (bottles) and is gaining share of market thanks to growing imports. Source: Beer Institute, Commerce Department and TTB, 2011
10% < share 2010 Draft Share of by State 8%< share < 10% 0%< share<8% US Average 9.7% in 2010 Almost 5 billion 16oz Servings Source: TTB and Beer Institute, 2011
2010 Top 10 Largest Draft States Top 10 Largest States have 55% of US Volume Source: Beer Institute, 2011
Growth 4.0% to 20% Draft Volume Growth, 2010 Growth -1.0% to +3.9% Growth -1.1 to -15% US Average +1.1% Source: TTB and Beer Institute, 2011
Thank You Beer Institute Washington, DC ljones@beerinstitute.org