Download
1 / 32
360 likes | 975 Vues
Ripple Effect Mapping: A Tool for Evaluating the Impacts of Complex Interventions. Presented at the 19 th Annual MESI Spring Training Conference. Scott Chazdon, Ph.D., Evaluation and Research Specialist Extension Center for Community Vitality

E N D
Ripple Effect Mapping: A Tool for Evaluating the Impacts of Complex Interventions Presented at the 19th Annual MESI Spring Training Conference Scott Chazdon, Ph.D., Evaluation and Research SpecialistExtension Center for Community Vitality Kit Alviz, M.A., Research Fellow, Extension Center for Family Development
Session Overview • Background – 20 minutes • Demonstration – 40 minutesWant to try mind mapping? Download from www.xmind.net • Discussion – 45 minutes
Session Learning Objectives • Describe the elements of the Ripple Effect Mapping process. • Identify the skills needed to facilitate a Ripple Effect Mapping session. • Give examples of the types of situations in which Ripple Effect Mapping would make sense. • Produce the first stage of a Ripple Effect mind map (optional). • Weigh the benefits and limitations of Ripple Effect Mapping as an evaluation tool.
Ripple Effect Mapping • Purpose – to better understand intended and unintended results of a program, intervention or collaborative for individuals, groups, sectors or communities. • Can be post-program (more summative) or mid-program (more developmental)
Direct vs. Indirect Impacts • Collaboratives and high engagement programs often build social capital, but don’t take credit for it. • People do not act in isolation -- strengthened social capital is a necessary pre-condition for other impacts • Other impacts may occur that were not foreseen in program theory
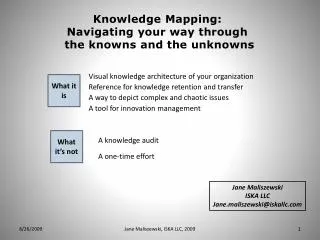
Mind Mapping – Radiant Thinking Pictorial Method • Note taking • Brainstorming • Organizing • Problem solving • Evaluation For more on mind mapping, see Buzan, T. (2003). The mind map book. London: BBC Books. Image: Mindmap, Graham Burnett, http://en.wikipedia.org/wiki/File:Mindmap.gif
Ripple effect mapping:related approaches • Concept Mapping (Trochim, 1989) • Mind Mapping (Eppler, 2006) • Outcome Mapping (Outcome Mapping Learning Community, 2011) • Participatory Impact Pathway Analysis(Douthwaite et al, 2008) • Most Significant Change (Davies 2005) • Appreciative Inquiry(Preskill & Catsambas, 2006)
How Does it Work? • Identify the intervention • Schedule the event and invite participants • Group mapping session held • Follow-up interviews • Cleaning, Coding, Analysis
Ripple effect mapping Method • Identify the intervention • High engagement program or position • Cross-sector initiative • Collaboration • Invite stakeholder group • Participants • Non-participant stakeholders • 12 to 20 participants • Two moderators
Ripple effect mapping Method • Appreciative Inquiry interview • Conducted among pairs of participants • Examples of questions: • Tell me a story about how you have used the information from the program? • Is there anything that resulting from the program that you are proud to share? • List an achievement or a success you had based on what you learned.
Ripple effect mapping Method • Starting the Map • On wall or using Mind Mapping software with data projector • Floating topics generated from Appreciative Inquiry • Different approaches
Theming and rippling - Building the Map • Theming • Group identifies which items are closely related • Group generates initial theme names • Floating topics moved and organized • Rippling • Group cross-validation • Potential for probing using the Community Capitals Framework
Ripple effect mapping Examples of Contexts where REM makes sense • Kit: State systems building to improve quality and quantity of child care • Scott: Community leadership development
Ripple effect mapping Demonstration of Mapping Process • Think back to your first program evaluation experience. • Is there anything that you gained from this experience that you are proud to share? • List an achievement or a success you had based on what you learned or who you met. • Did the experience lead to other important developments in your personal or professional life? • Floating topics • Beginning to categorize
Example: Ripple Effect Map of Community Gardening in Frogtown & Rondo neighborhoods
Example: Ripple Effect Map of Community Gardening in Frogtown & Rondo neighborhoods
Example: Ripple Effect Map of Hugo, MN Business Retention and Expansion program
Example: Ripple Effect Map of Child Care Expansion Initiative
Ripple effect mapping Cleaning, Coding, Analysis • Organize map to better identify pathways or combine pathways • Download data to Excel for coding • Code using relevant thematic framework andtype of outcome • KASA = something learned • Behavior change = action taken • Impact = change in system • Follow-up interviews if more clarity is needed
The Community Capitals Framework (Emery and Flora, 2008)
Ripple effect mapping Coding Demonstration
Reporting Example (Child Care Expansion) Appendix – Ripple Effect Tables
Benefits • Simple and cheap tool • Captures impacts of complex or evolving work • Captures intended and unintended impacts • Participatory and appreciative approach that engages stakeholders • Group validation of results
Limitations • Risk of bias in participant selection and data collection • Participants may not have complete information about a program or program outcomes • Potential for inconsistency in implementation
Suggestions • Use same facilitator, recorder and “mapper” • Develop a facilitator guide with ideas for probes. • Make decision prior to mapping whether to use a pre-existing framework as probes during group interviews • May need to recognize that one organization isn’t trying to take all credit for all change • It is important to probe for negatives
Lessons Learned Thus Far • Find the right balance between breadth and depth • Schedule the event along with another activity • Put much effort into recruitment and explaining the process • Choose a good setting – not too informal • Use external facilitators, not program staff
References • Baker, B., Calvert, M., Emery, M., Enfield, R., & Williams, B. (2011). Mapping the impact of youth on community development: What are we learning? [PowerPoint slides]. Retrieved from http://ncrcrd.msu.edu/uploads/files/133/Mapping%20Impact%20of%20Youth%20on%20Com%20Dev%2012-3-10.pdf • Buzan, T. (2003) The Mind Map Book. London: BBC Books. • Douthwaite, B., Alvarez, S., Thiele, G., & MacKay, R. (2008). Participatory impact pathways analysis: A practical method for project planning and evaluation. ILAC Brief 17. • Emery, M., & Flora, C.B. (2006). Spiraling-up: Mapping community transformation with community capitals framework. Community Development: Journal of the Community Development Society 37(1), 19-35. • Eppler, M.J. (2006). A Comparison Between Concept Maps, Mind Maps, Conceptual Diagrams, and Visual Metaphors as Complementary Tools for Knowledge Construction and Sharing. Information Visualization 5:202-210. • Hansen Kollock, D.A., Flage, L, Chazdon, S., Paine, N., and Higgins, L. (2012). Ripple Effect Mapping: A “Radiant” Way to Capture Program Impacts. http://www.joe.org/joe/2012october/tt6.php • Kollock, D. A. (2011). Ripple effects mapping for evaluation. Washington State University curriculum. Pullman, WA. • Outcome Mapping Learning Community website. (2011). http://www.outcomemapping.ca • Preskill, H. & Catsambas, T.T. (2006). Reframing evaluation through appreciative inquiry. Thousand Oaks: Sage Publications.
Contact information Scott Chazdon, Ph.D. Evaluation and Research Specialist Center for Community Vitality 612-624-0982 schazdon@umn.edu Kit Alviz, M.A. Research Fellow Center for Family Development 612-625-8271 alviz002@umn.edu