Download
1 / 30
300 likes | 425 Vues
A 1-year simulation of atmospheric concentrations and deposition over Europe and UK. Alan Cocks, Vicky Lucas, Ian Rodgers, and Ian Teasdale RWEInnogy Environment. Air Quality in Europe and UK. UNECE Gothenburg Protocol Emission ceilings on SO 2 , NO x , VOC, and NH 3

E N D
A 1-year simulation of atmospheric concentrations and deposition over Europe and UK Alan Cocks, Vicky Lucas, Ian Rodgers, and Ian TeasdaleRWEInnogy Environment
Air Quality in Europe and UK • UNECE Gothenburg Protocol • Emission ceilings on SO2, NOx, VOC, and NH3 • EU Air Quality Framework directive • NECD • LCPD • New model required for new issues…. • ….to open up a wider debate
Why did we choose Models3 • Modular and future-proofed • Covers a range of spatial and temporal scales • Flexible • Complete • Available
Development strategy • Choose a suitable domain • Build the key inputs (emissions, meteorology) • Build and test the model (hard wired features !) • Develop a methodology and tools • Validate the ‘vanilla’ model for one month • A key hurdle is the simulation of air quality and wet deposition statistics for a full year - was it feasible ?
Development strategy 2 • Achieved through a joint JEP/EA project - the subject of this presentation • Currently looking at ozone and secondary particulates • Investigated aggregation schemes • Stakeholder workshop in April 2003 • Results are being made available • Achieved by a small team and minimal effort
Practical Matters • CMAQ: April 2001 (version 4.1) without front end • SMOKE v1.4b (MEPPS couldn’t be used) • Hardware: 2* Sun SPARC II Dual Processor (400MHz) • Sun Solaris OS5 and f90 compiler • Options: • PPM for advection; QSSA for chemistry, • RADM2_AQ_AE; no PING; AERO1 • Run times: around 158 hrs CPU for 1 month simulation
Meteorological Data Processing • Used external data from UKMO rather than MM5 • Analysis fields from NWP • Archive of initial (T+0) fields from forecast runs • Have observed data assimilated • Best estimate of historical 3D weather data • Met Office format • Latitude/Longitude horizontal grid • Eta levels in the vertical • Had to be re-gridded • 3 hour time steps, linearly interpolated to 1 hour for CMAQ
Sources of meteorological data • Global meteorological data • Grid length approximately 60km at mid-latitudes • Global coverage • For this study Europe 30W to 45E, 29N to 69N • Used for the 108km CMAQ runs • Mesoscale meteorological data • Grid length approximately 12km • Covers UK and France • Used for the 36, 12 and 4km CMAQ runs
Emission modelling • Aim to take the data from readily available source • 24 species for RADM2_AE_AQ • EMEP database: 50km x 50km by sector • NOx, SO2, CO, NH3, NMVOC, particulates • used for 108 km grid • GEIA database • natural emissions: isoprenes, terpenes, volcanic • NAEI database: 1km x 1km for UK by source type • UK Power station data
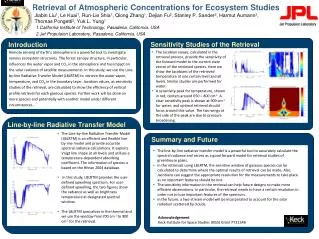
AQ time series a b c Bottesford: daily a) SO2 b) NO2c)PM10
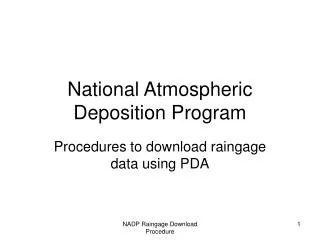
Correlation Mean Annual Modelled/Measured SO2 NO2 PM10 NH3 SO2 NO2 PM10 NH3 Bottesford 0.69 0.84 0.56 1.13 1.18 0.84 Eskdalemuir 0.46 -0.58 2.29 3.14 Harwell 0.46 0.51 2.40 1.37 High Muffles -0.40 1.93 Lady Bower 0.51 0.67 1.16 1.61 Lullington Heath 0.47 0.76 -0.47 2.05 1.49 4.09 Narbeth 0.65 0.68 0.42 0.51 1.15 0.64 Redcar -0.15 0.28 0.34 1.25 1.40 0.54 Rochester 0.21 0.76 0.46 1.73 1.55 1.00 Wicken Fen 0.75 0.85 1.85 0.85 Yarner Wood 0.33 0.36 0.44 1.68 Model – measurement comparison for AQ
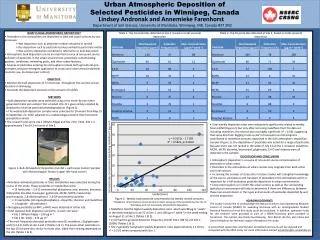
Correlation Mean Annual Modelled/Measured Rainfall SO42- NO3- NH4+ Rainfall SO42- NO3- NH4+ Barcombe Mills 0.62 0.62 0.39 0.47 0.69 0.69 1.03 1.64 Bannisdale 0.71 0.44 0.14 -0.01 0.83 0.58 0.65 0.75 Bottesford 0.82 0.74 0.70 0.72 1.41 0.92 1.05 1.11 Compton 0.85 0.78 0.82 0.78 1.07 0.65 0.81 0.83 Eskdalemuir 0.83 0.58 0.50 0.51 0.98 1.06 1.55 2.11 Flatford Mill 0.68 0.59 0.59 0.19 1.25 0.75 0.92 1.04 High Muffles 0.87 0.68 0.70 0.71 0.95 0.57 0.68 0.78 Preston 0.80 0.73 0.73 0.74 1.15 0.80 0.93 0.91 Tycanol Wood 0.57 0.61 0.61 0.31 1.15 0.63 1.12 1.76 Yarner Wood 0.78 0.61 0.72 0.62 1.10 0.85 1.13 1.84 Model – measurement comparison for wet deposition.
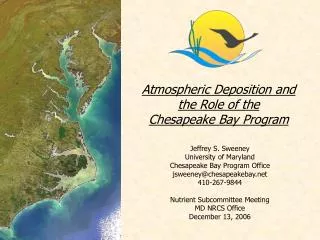
Comparison of measured and modelled Ozone and associated species
Summary of conclusions from study • Successful annual simulation carried out using freely available UK data • Ratio of modelled to measured for Annual wet deposition is 0.7 (sulphate), 1.0 (nitrate) and 1.2 (ammonium). Acceptable correlation for sulphate and nitrate. • For air quality the modelled/measured ratio is 1.3 for SO2, 1.4 for NO2, and 0.8 for particulate. Time series correlation is 0.72 for NO2 • Models-3 performance compares favourably with the EMEP Lagrangian model. • Total wet deposition maps are in fair agreement with interpolated measurements. • Some usability issues • Some modelling issues to resolve • Models-3 is a suitable model for use as a high-resolution long-range transport model for the UK and Europe.