Download
1 / 65
650 likes | 765 Vues
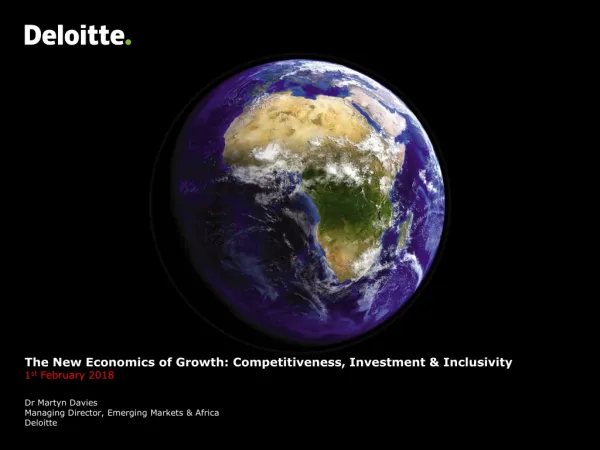
In the face of rising global inequality, Dr. Martyn Davies explores the dynamics of economic growth, competitiveness, and inclusive investment. Emphasizing structural reforms, he highlights historical crises as catalysts for change, particularly in emerging markets like Nigeria and Eastern Europe. The discourse analyzes disparities in wealth and productivity between nations, linking technological transfer and economic resilience to structural developments. As observed in the last few decades, Dr. Davies warns against the complacency that could lead to prolonged divergence between advanced economies and emerging markets.

E N D
Headline Verdana Bold The New Economics of Growth: Competitiveness, Investment & Inclusivity 1st February 2018 • Dr Martyn Davies • Managing Director, Emerging Markets & Africa • Deloitte
Structural reform is most often impossible without a crisis Eastern Europe (1989-1991)
Structural reform is most often impossible without a crisis Republic of Korea (1996-1998)
Structural reform is most often impossible without a crisis Nigeria (July 2014-current )
Inequality is the burning issue of our time When Adam Smith published the Wealth of Nations in 1776, the richest country in the world was 4 times richer than the poorest country Prior to the Industrial Revolution, inequality was prevalent within countries. After its consolidation, inequality is now primarily between nations In 2017, the USA was 268x richer per capita than South Sudan! Inequality is a productivity problem Source: IMF, 2017
The Industrial Revolution • It created: • A larger accessible market • Larger political entities • A larger set of public goods: education, health, pensions, unemployment insurance, infrastructure
The Great Convergence The Wheel has been turning faster Great Britain United States China • Prior to the 18th century: 1,400 years to double income in the West • In the 19th century, about 70 years • In the 20th century, about 35 years
Why can technology not be transferred? • A combination of the following is required: • Tools (products) • Codes (information) • Know-how (collective experience, expertise) • Together, these ingredients form “technology” and IP
The Decade of Convergence Output per person in the Emerging World almost doubled between 2000 and 2009, with the average annual rate of growth over that decade being 7.6%; 4.5% higher than the rate in rich countries As a result the gap between developed and developing worlds narrowed At this rate, the EM world’s (all things being equal) average income per capita would converge with that of the US in just over 30 years This period can be called “the great catch-up” But…
What was the Golden Growth Decade? • In 2007, all but 3 of the 183 countries monitored by the IMF grew (except Fiji, Zimbabwe and Congo); and 114 of them by more than 5% • Only 50 countries had managed a growth rate of more than 5% in the previous 2 decades • In 1980 only 16 countries had inflation of less than 5%; by 2007, 103 countries had inflation of less than 5% Growth rate of private capital flow to developing countries Private capital flow to developing countries Source: IMF
The Decelerating World 1/3 of previous growth rate 1/5 of previous growth rate 2/3 of previous growth rate Source: IMF
The myth of convergence Output per person in the Emerging World almost doubled between 2000 and 2010, with the average annual rate of growth over that decade being 6.9%; 3.7% higher than the rate in rich countries Despite the higher growth, base effects meant that the gap between developed and developing worlds widened Source: IMF, 2017
The future is divergence Since 2008, the average GDP per head in the EM world (measured in PPP) grew just 3.1% faster than average GDP per head in advanced economies over the same period In the years after the global financial crisis, the situation has worsened: growth rate gap in 2010 was 3.5%; only 1.5% in 2016 • Growing at the 2010 growth gap rate, it would take 42 years for EM to reach GDP/capita levels that advanced economies have now • Growing at the 2016 growth gap rate, it would take 95 years to catch up to where advanced economies are now! The great expectations of the previous decade are likely to be dashed. This will be the dominant feature of modern economic history Source: IMF, 2017
The Future is Divergence Since 2008, the average GDP per head in the EM world (measured in PPP) grew just 2.6% faster than US GDP in 2013…if China is excluded from the calculation then the difference is just 1.1% At this rate, catch up with the rich world will take 115 years! (excluding China) But things are getting worse…. Using the IMF’s 2015 growth projections, the outlook is bleaker The difference in developed vs EM growth (other than China) is just 0.39% -- this pushes out convergence to 300 years! The great expectations of the past decade are likely to be dashed This will be the dominant feature of modern economic history
The Growth Coupling Effect - China-Africa growth trajectories No correlation in growth trends between China and SSA prior to 1996 Correlation from 2000, coinciding with China’s Africa Policy Strong African growth on the back of robust resource demand from China Correlation between 2000-2015 is 84% Source: IMF, 2017
Africa’s heavy commodity dependency Commodity exports as share of merchandise exports (%), 2016 An overreliance on at times a single commodity and lack of manufacturing activity has seen African countries vastly affected by the commodity price downswing. Commodity exports account for >80% of merchandise exports in 33% of African countries Commodity exports account for >70% of merchandise exports in 48% of African countries Source: UNCTAD & Deloitte Analysis, 2017, NB: Commodity exports include all primary products (unprocessed goods) as classified by Lall (2000)
Manufacturing in African economies Manufacturing value added % of GDP, 2016 Sub-Saharan Africa average Source: WDI & Deloitte Analysis, 2017
Manufacturing in African economies Manufacturing employment % of total employment, 2016 Source: BMI, 2017
Manufacturing in African economies Manufactures share of merchandise exports, 2016 Manufacturing exports account for >50% of merchandise exports in only 5 out of 54 African countries Manufacturing exports account for less than 50% of merchandise exports in 90% of African countries Manufacturing exports account for less than 20% of merchandise exports in 57% of African countries Sub-Saharan Africa average Source: UNCTAD & Deloitte Analysis, 2017, NB: Manufactured merchandise includes low to high technology manufactures as classified by Lall (2000)
Declining Manufacturing in South Africa Manufacturing % share of GDP and unemployment (%) in South Africa, 1995-2016 Source: IMF & World Bank, 2017
South Africa Manufacturing Employment vs GDP Per Capita Source: BMI, IMF, The Conference Board Total Economy Database, 2016
South Africa Relative Manufacturing Productivity vs GDP Per Capita Source: BMI, IMF, The Conference Board Total Economy Database, 2016 *Relative Productivity = Total Output per Hour Worked in Manufacturing
Africa’s Competitiveness Most competitive economies globally and in SSA, 2016-17 Source: WEF, 2017
South Africa’s Competitiveness dropped from 47 to 61 South Africa’s top and worst pillars of competitiveness, 2016-17 and 2017-18 Source: WEF GCR, 2016 & 2017
South Africa’s global competitiveness South Africa dropped from 47th spot to 61st spot in the Global Competitiveness ranking within the last year SA’s global competitiveness 2016/17 & 2017/18 8 out of 12 pillars deteriorated, 1 remained stable, 3 improved marginally Note: 2016/17: out of 138 countries; 2017/18: out of 137 countries Source: WEF, 2016/2017
SSA sets record for business reforms Doing Business 2018 reports that 83 reforms were made across SSA over the last 12 months, compared to 81 reforms reported in the 2017 edition. As such, a total of 798 reforms have been made in 48 SSA economies over the last 15 years. Over the past 15 years, the biggest reformers in the region have been Rwanda, with an aggregate 52 reforms, followed by Kenya with 32 reforms and Mauritius with 31 reforms. Top 10 vs. bottom 10 SSA Doing Business 2018 rankings (out of 109 countries)
Rwandan Doing Business reforms Rwanda has made 52 reforms over the last 15 years, making it the biggest reformer in the region. In the 12 months ending July 2017 alone, Rwanda made five reforms – improving dealing with construction permits, registering property, protecting minority investors, paying taxes, and enforcing contracts. As a result, the country is now ranked 41st globally out of 190 countries, and second (behind Mauritius) in SSA.
Manufacturing vital for lower inequality Countries with high levels of manufacturing value added (MVA) present opportunities for employment and higher equality • South Korea is primary example of high MVA with low inequality • While Mexico bucks the trend overall , the auto manufacturing hub is thriving The countries with the highest Gini coefficients (i.e. most inequality) have lower MVA as a % of GDP • The average amongst this group is 10% of GDP • South Africa highest MVA (13.4% of GDP); Botswana the lowest (6.4% of GDP) Low equality countries Countries with high levels of MVA (% of GDP) *2015 MVA estimate **MVA estimate not available Source: World Bank, 2017
Manufacturing vital for low inequality Source: World Bank; CIA, 2017
China’s exports 1962 Source: Atlas of Economic Complexity, 2017
China’s exports 2016 Source: Atlas of Economic Complexity, 2017
Vietnam’s exports 1962 Source: Atlas of Economic Complexity, 2017
Vietnam’s exports 2016 Source: Atlas of Economic Complexity, 2017
Nigeria’s exports 1962 Source: Atlas of Economic Complexity, 2017
Nigeria’s exports 2016 Source: Atlas of Economic Complexity, 2017
Angola’s exports 1962 Source: Atlas of Economic Complexity, 2017