Download
1 / 16
160 likes | 283 Vues
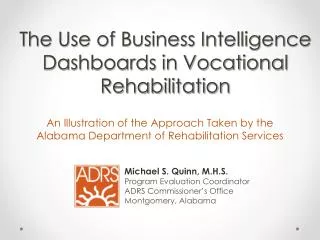
The Use of Business Intelligence Dashboards in Vocational Rehabilitation. Michael S. Quinn, M.H.S. Program Evaluation Coordinator ADRS Commissioner ’ s Office Montgomery, Alabama. An Illustration of the Approach Taken by the Alabama Department of Rehabilitation Services.

E N D
The Use of Business Intelligence Dashboards in Vocational Rehabilitation Michael S. Quinn, M.H.S. Program Evaluation Coordinator ADRS Commissioner’s Office Montgomery, Alabama An Illustration of the Approach Taken by the Alabama Department of Rehabilitation Services
…You have to choose the one that works best for you. 3. Working out accessibility for users who are blind was an issue that was tough to solve. …We did find a way, although there wasn’t a roadmap to follow. We’re proud to say these dashboards are accessible. 2. Of course, our dashboards rely upon the data entered daily into our electronic case management system OK, geez, can we get on with it already? 4. There are several Business Intelligence products on the market. Wait! One last thing. But first, a few disclaimers… … So, you can only get out of it what you already have. Our system launched in 1999. …Ultimately, we chose Microsoft products. They best fit our existing system and our needs. 1. This took a while to develop. About 2 years to see something like what will be presented.
MEDIUM MESSAGE
Can you see a difference between typical reporting and the dashboard example given? What do you think about the approach that was taken toward transparency – aka. Everyone can see everyone else’s stuff? Part III
2007 2009 2010 2011 FY 2012 1999- AWARE (web based case management application) Development Complete ADRS elects to maintain and develop the AWARE application locally “SMILE” enters everyday use by ADRS VR Counselors Data regarding VR Services and Activities accumulate within ADRS Databases – the Foundation of Reporting
1999- 2007 2009 2010 2011 FY 2012 2007 RSA 107 Review VR Admin & IT Staff begin to look at Business Intelligence options
1999- 2007 2009 2010 2011 FY 2012 New Commissioner Redefined Program Evaluation Position to include the Coordination of Business Intelligence Staffed this Position
1999- 2007 2009 2010 2011 FY 2012 Federal Stimulus Funds SharePoint 2010 & PerformancePoint Selected and Purchased Groundwork Development of Metrics and Key Performance Indicators Designated BI Position in Computer Services
1999- 2007 2009 2010 2011 FY 2012 VR Dedicates a Subject Matter Expert to the BI Team Technology & People in Place… Development of Data Warehouse and a first “Cube” Data Source True Dashboard Implementation Begins
1999- 2007 2009 2010 2011 FY 2012 VRBI Site with “Operations Dashboard” Released 2012 RSA 107 Review ICI Award Enables Further Development of BI Resources as a Performance Management Tool 2nd Generation Dashboard Released
2014 2015 2016 2017 FY 2018 FY 2013 Two new Dashboards Made Available Created a VRBI Notification Center to identify Concerns and Gather Staff Feedback Working with ICI to Provide “Demand-Side” BI Resources to VR Counselors and Job Developers
The Philosophy we have Adopted: • Selection of Performance Measures: • Insist on outcome measures focused on the real mission • Show people how they play a direct part in the achievement of the mission (ex. of RSA indicator “roll up”) • Tell the story of performance with as much context possible – be fair, an alignment of resources may be necessary. • Performance over Punishment • Dashboards should create dialogue • Transparency is essential – these are shared knowledge resources
The Philosophy we have Adopted: • The Message to ADRS Staff: • We’re getting rid of information inequities • We trust you with this information and expect that you use it • We are all accountable at every level • By sharing the agency’s knowledge resources we are investing in your professional development • Collectively, we’re smarter…