Download
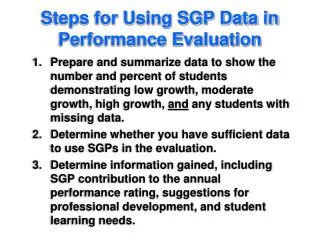
1 / 35
460 likes | 981 Vues
CDC’s Framework for Program Evaluation in Public Health Step 4. Gather Credible Evidence Using surveillance data in your evaluation. Linda Leary Field Services Evaluation Branch Lori Armstrong Surveillance, Epidemiology, and Outbreak Investigations Branch Surveillance Team.

E N D
CDC’s Framework for Program Evaluation in Public HealthStep 4. Gather Credible EvidenceUsing surveillance data in your evaluation Linda Leary Field Services Evaluation Branch Lori Armstrong Surveillance, Epidemiology, and Outbreak Investigations Branch Surveillance Team
Evaluation is an Essential Organizational Practice Program evaluation is not practiced consistently across program areas, nor is it well-integrated into the day-to-day management of most programs. Program evaluation is necessary to fulfill CDC’s operating principles for public health, which include: • Using science as a basis for decision-making and action; • Expanding the quest for social equity; • Performing effectively as a service agency; • Making efforts outcome-oriented; and • Being accountable
Six Steps in Program Evaluation • Engage stakeholders • Describe the program • Focus the evaluation design • Gather credible evidence • Justify conclusions • Ensure use and share lessons learned webinar site: http://www.cdc.gov/nchstp/tb/Program_Evaluation/default.htm
Overview • Define surveillance data and their use • Using surveillance data to determine evaluation focus and develop evaluation questions • Using surveillance data as a source of credible evidence • Issues and concerns on data quality and completeness, and what you can do about it
How can a local TB program use surveillance data to conduct evaluations? • The national TB program requires each grantee to write an evaluation plan by Dec. 16, 2005. • Surveillance data can help ensure the right evaluation questions are identified, and • Surveillance data can be used to set meaningful benchmarks for progress.
How can a local TB program use surveillance data to conduct evaluations? TB surveillance data can also be used as one source of credible evidence to compare: Local objectives against national objectives; Local area objectives within a state; and Look at the trend of data over a period of time.
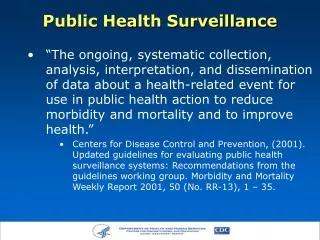
Surveillance Definition • Ongoing systematic collection, analysis, and interpretation of outcome-specific data. • For use in planning, implementation, and evaluation of public health practice.
Uses of Surveillance Data Public health surveillance is an important part of the information feedback loop that links the public, health care providers, and health care agencies. These data can be useful in posing questions for your evaluation design, such as: • How to identify people and groups of people at risk for disease? • How to prioritize health needs in persons at higher risk for disease exposure or infection accompanied by a plan for follow-up? • How to incorporate surveillance data as a source of information for program planning and evaluation? • How to use indicators to determine if a condition exists or certain results have been achieved?
Indicators Indicators are at the heart of a performance monitoring system. • They provide a basis for collecting credible evidence that is valid and reliable for evaluation. • Describes progress in achieving its objectives. • Tells us what to measure to determine whether the objective has been achieved.
How do you calculate the TB Case Rate? • RVCT variable item #6 – month year counted • Data is obtained from the RVCT. [The health department is responsible for: counting TB case by month year, verifying the case as TB, and including it in the official case count.] • The national annual surveillance report publishes the total number of TB cases by state. • Population estimates from the US Census Bureau • http://www.census.gov/popest
Calculation of TB Case RateYear 2000 – State X • Population of State X = 554,817 • # of TB Cases for Year 2000 State X = 42 42 / 554,817 x 100,000 = 7.6 per 100,000
How do you calculate the TB Case Rate? • RVCT variable item #6 – month year counted • Data is obtained from the RVCT. [The health department is responsible for: counting TB case by month year, verifying the case as TB, and including it in the official case count.] • The national annual surveillance report publishes the total number of TB cases by state. • Population estimates from the US Census Bureau • http://www.census.gov/popest
Guidance documents in measuring outcomes • Using the RVCT as an Evaluation Tool • Exercises from the Program Manager’s Course. • Request copies of draft documents: lsl1@cdc.gov
The Online TB Information System(OTIS) • A query-based public use data set of national TB surveillance data from 1993 through 2003 • It includes the 50 states, District of Columbia, and Puerto Rico • Maintains confidentiality by de-identifying, aggregating, or suppressing data • Performs queries and ad hoc cross-tabulations on 22 variables from the RVCT • Supplements annual surveillance report • “Housed” on WONDER server • http://wonder.cdc.gov/tb
OTIS:current status • Each state signed a data release agreement form to accept or refuse participation in OTIS. • States reviewed OTIS for several months • Data were checked and changes made based on your suggestions • Release date: November 2005 • Anticipate 2004 data will be available March 2006
Data Completeness • TIMS data are evaluated for overall completeness each month • The goal for percent completeness of each RVCT (TIMS) variable is based on GPRA goals or on tradition • Each RVCT variable has a completeness goal, usually 95% to 99% Missing and Unknown Reports (MUNK) • MUNK Reports provide information on RVCT (TIMS) variables that are below the completeness goal • MUNK reports are sent to each TB program or recording area 1 to 3 times/year and to the FSEB Consultant for that area.
Missing and Unknown Variables 2004 RVCT Data
Data Quality • High quality RVCT data are essential for proper interpretation of data for TB control programs • Inconsistent or inaccurate data can lead to inappropriate associations and unrecognized biases in research • Examples of miscoded information • People from India were coded as American Indian - (reclassified to Native American/Alaskan Native in 2003) • Young children were coded as alcoholics or IDUs - (Children born to IDUs and alcoholics are not drug abusers or alcoholics) • People born in the Philippines or Japan were coded as “Native Hawaiian and Other Pacific Islander”
Native Hawaiian and Other Pacific IslanderMiscoded information In preparation for the 2005 World TB Day MMWR article, we found 37 foreign-born TB cases who were incorrectly coded as “Native Hawaiian and Other Pacific Islander” Incorrect NH/OPI cases were coded in TIMS as foreign born and from other countries such as Philippines, Japan, Laos, Vietnam, India, Somalia, Iran, Ecuador, Brazil
TB cases by Asian, NH/OPI race, United States, 2004 (provisional data) Native Hawaiian and Other Pacific Islander rate was not reported in the World TB Day MMWR. The count was included in the category “Other/Unknown”
Native Hawaiian and Other Pacific Islander: Correct Definition • First introduced as a race code in 2003 • TIMS Race and Ethnicity Classification (9/4/2002) lists all the islands classified as Other Pacific Islands and countries that are considered Asian. • Examples • NH/OPI: Carolinian, Chamorro, Fijian, Guamanian, Kiribati, Papua New Guinean, Polynesian, Saipanese, Samoan, Solomon Islander, Hawaiian Islands • Asian: Filipino, Bhutanese, Asian Indian, Singaporean, Taiwanese, Okinawan, Nepalese, Hmong, Iwo Jiman
Summary • Follow the six steps in the CDC Framework in conducting your evaluation. • Use surveillance data as one source of credible evidence to use in evaluation. Also, consider using OTIS as another source of gathering information. • Strive for data quality. Quality refers to the appropriateness and integrity of information used. Good decisions are based on accurate data.
Contacts • Linda Leary 404.639.8342 lsl1@cdc.gov • Lori Armstrong 404.639.8860 lra0@cdc.gov
QUESTIONS ? ? ? ? ? ? ? ? ?