INFERENCE: CONFIDENCE INTERVALS
INFERENCE: CONFIDENCE INTERVALS. Chapter 8. 8.1 What are Point and Interval Estimates of Population Parameters?. Point Estimate and Interval Estimate. A point estimate is a single number that is our “best guess” for the parameter

INFERENCE: CONFIDENCE INTERVALS
E N D
Presentation Transcript
INFERENCE: CONFIDENCE INTERVALS Chapter 8
8.1 What are Point and Interval Estimates of Population Parameters?
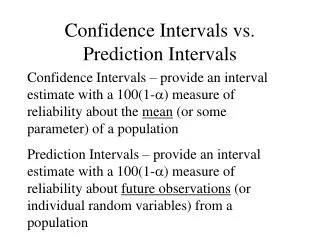
Point Estimate and Interval Estimate • A point estimateis a single numberthat is our “best guess” for the parameter • An interval estimateis an interval of numberswithin which the parameter value is believed to fall.
Point Estimate vs. Interval Estimate • A point estimatedoesn’t tell us how close the estimate is likely to be to the parameter • An interval estimateis more useful • It incorporates a margin of error which helps us to gauge the accuracy of the point estimate aiaccess.net
Properties of Point Estimators • Property 1: Good estimator has sampling distribution centered at the parameter • An estimator with this property is unbiased • Sample mean [proportion] is an unbiased estimator of population mean [proportion]
Properties of Point Estimators • Property 2: Good estimator has smaller standard error than other estimators • Falls closer than other estimates to parameter • Sample mean has a smaller standard error than sample median montenasoft.com
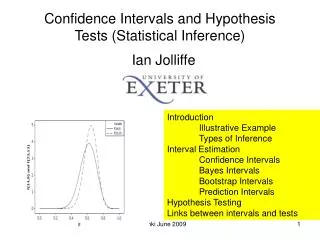
Confidence Interval • An interval containing the most believable values for a parameter • The probability that the interval contains the parameter is the confidence level • Close to 1, most commonly 0.95 comfsm.fm
Logic of Confidence Intervals gmatclub.com
Margin of Error • Measures accuracy of point estimate in estimating a parameter • Multiple of standard error • 1.96 standard errors for a 95% confidence interval of p
CI for a Proportion 19% of 1823 respondents agreed, “It is more important for a wife to help her husband’s career than to have one herself.” Assuming standard error is 0.01, calculate a 95% CI for p who agreed. 2.bp.blogspot.com
8.2 How Can We Construct a Confidence Interval to Estimate a Population Proportion?
Protecting the Environment “Are you willing to pay much higher prices in order to protect the environment?” • 1154 respondents, 518 willing Find and interpret a 95% confidence interval
Needed Sample Size for CI of P eaststaffsbc.gov.uk
Confidence Levels Other than 95% • 95% confidence means a 95% chance that contains p • With probability 0.05, CI misses p • To increase chance of a correct inference, use larger confidence level, such as 0.99
Confidence Levels Other than 95% We must compromise between desired margin of error and desired confidence of a correct inference thefreemarketeers.files.wordpress.com
CI for a Proportion Of 598 respondents, 366 said yes, “If the wife in a family wants children, but the husband does not, is it all right for the husband to refuse to have children?” Assuming standard error is 0.01, calculate a 99% CI for p who said yes. vitaminsandnutrition.files.wordpress.com
Summary pirate.shu.edu
Effects of Confidence Level and Sample Size on Margin of Error The margin of error for a confidence interval: • Increases as confidence level increases • Decreases as sample size increases
Interpretation of Confidence Level For 95% confidence intervals, in the long run about 95% of those intervals would give correct results, containing the population proportion, p
8.3 How Can We Construct a Confidence Interval to Estimate a Population Mean?
Properties of the t Distribution • Bell-shaped and symmetric about 0 • Probabilities depend on degrees of freedom, df = n-1 • Has thicker tails (more spread out) than standard normal distribution
95% Confidence Interval for μ boost.org
If the Population is Not Normal, is the Method Robust? • Basic assumption is normal population distribution • Many distributions far from normal • Abnormal distributions are okay for large n because of the CLT • CIs using t-scores usually work well: except for extreme outliers, the method is robust urbanbacon.com
Sample Size for Estimating μ statcan.gc.ca
Factors Affecting Choice of Sample Size? • Desired precision, as measured by the margin of error, m • Confidence level • Variability in data - If subjects have little variation (σis small), we need fewer data than with substantial variation • Financial schoolloans.org
Using a Small n • The t methods for μ are valid for any n, but look for extreme outliers or great departures from normal • For a population proportion, p, the method works poorly for small samples because the CLT no longer holds stat.psu.edu
CI for p with Small Samples businessandlearning.com