Download
1 / 1
10 likes | 128 Vues
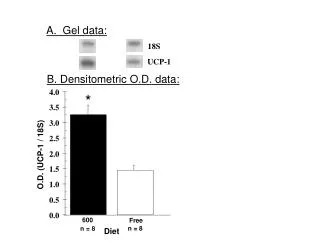
Explore the relationship between UCP-1 and 18S genes using densitometric OD data. The O.D. data comparison reveals insights into gene expression levels. Sample size of 8 with various diets evaluated.

E N D
A. Gel data: 18S UCP-1 B. Densitometric O.D. data: 4.0 * 3.5 3.0 O.D. (UCP-1 / 18S) 2.5 2.0 1.5 1.0 0.5 0.0 600 Free n = 8 n = 8 Diet