Download
1 / 10
100 likes | 287 Vues
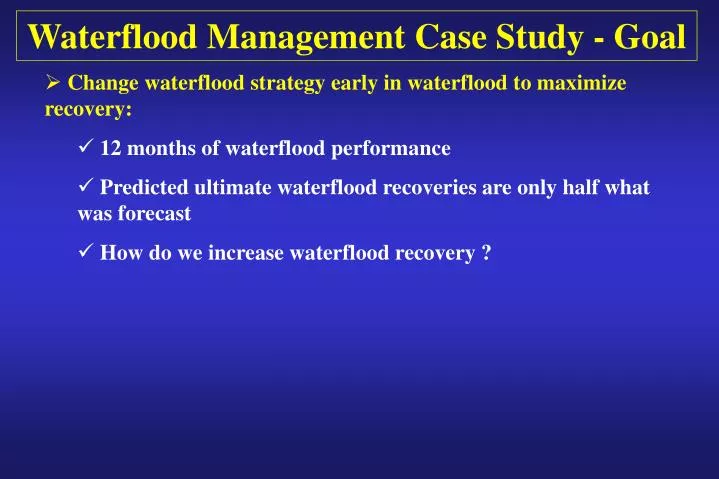
Waterflood Management Case Study - Goal. Change waterflood strategy early in waterflood to maximize recovery: 12 months of waterflood performance Predicted ultimate waterflood recoveries are only half what was forecast How do we increase waterflood recovery ?.

E N D
Waterflood Management Case Study - Goal • Change waterflood strategy early in waterflood to maximize recovery: • 12 months of waterflood performance • Predicted ultimate waterflood recoveries are only half what was forecast • How do we increase waterflood recovery ?
Waterflood Management – How ? • Step 1 - Design optimal waterflood strategy: • History match primary production • Step 2 - Change waterflood strategy continuously in real time to maximize recovery: • Why ? • Primary history match does not normally require understanding vertical/areal heteregenities • How ? • Downhole pressure data + tracer tests + simulator
Waterflood – Tracer versus Pressure • Pressure Advantages: • Effect of pressure seen 10 times faster than tracer response • Time is money !
Proposed Waterflood Sweep in Unconformity After 650 days of flooding :
Proposed Waterflood Sweep in Upper After 650 days of flooding :
Pressure Contour Maps in Both Sands After 285 and 650 days of flooding :
Waterflood Results – Correct Perm Map Bypassed oil identified before water breakthrough Areas with water overinjection identified
Waterflood Study Case Study - Results • Downhole pressures/production information was used to: • Generate accurate permeability distribution maps in the model • Discover bypassed oil/overinjection long before breakthrough: • Breakthrough anticipated in 3-96 months • Water injection strategy changed within first 15 months • Waterflood recovery may now be doubled • Overall water injection rates reduced by 30%