Download
1 / 10
100 likes | 242 Vues
This report examines the metrics of the 101 Service calls from the year-to-date, including the maximum wait time, the total calls answered, and the service level percentages. It also highlights the incident category breakdown and explores customer satisfaction results from a survey of 499 participants. Customers reported their alternative contact options if the 101 Service was unavailable and how they learned about the 101 number. The findings indicate a high satisfaction rate and insights into public awareness channels for the service.

E N D
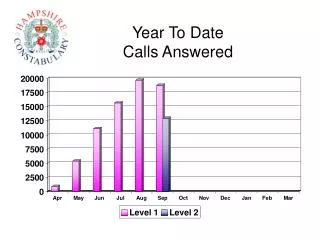
Max Wait TimeCalls Answered Seconds Minutes
Incident Category Breakdown September 2006 Out of Scope Calls – 3,345
Customer QuestionnaireQuestion 1 If the 101 Service was not available to you to report the issue that you have phoned about today, who if anybody would you have contacted ? Phone 999 89 17.84% Contact Local Police Station 86 17.23% Contact 0845 143 28.66% Call into Police Station 29 5.81% Phone Local Council 20 4.01% Police Officer in Street 7 1.40% 499 People Surveyed
Customer QuestionnaireQuestion 2 Where did you hear about the 101 number that prompted your call today Television & Radio 77 15.59% Newspapers & Magazines 51 10.32% Websites 6 1.21% Word of Mouth 105 21.25% Leaflets 129 26.11% Posters 17 3.44% Other 109 22.06% 494 People Surveyed
Customer Satisfaction Survey Out of 100 Surveys 91% are Very Satisfied or Satisfied 52% Very Satisfied 39% Satisfied 6% Neither Satisfied Or Dissatisfied 3% Dissatisfied 0% Very Dissatisfied