Understanding Rate of Change and Slope in Real-Life Scenarios
270 likes | 406 Vues
This document explores the concept of rate of change through practical examples, such as Jack's babysitting earnings and the financial implications of hours worked. We integrate informal ideas of rate of change with the mathematical structure of slope, defining slope as the measure of a line's steepness. Through visual examples and mathematical equations (m = (y2 - y1) / (x2 - x1)), we illustrate how to determine the slope of lines between two points. Additionally, we discuss linear versus non-linear relationships through first differences and real-world scenarios like free-fall and the motion of a snake.

Understanding Rate of Change and Slope in Real-Life Scenarios
E N D
Presentation Transcript
Jack’s Babysitting Earnings Earnings Hours Worked
Amount of Interest Earned Amount Time
We will attach the informal idea of rate of change with the mathematical structure of slope
Engineers have created a mathematical measure for the steepness of a line Slope: The measure of a line’s steepness
Rise Slope = Run Rise Run
Rise Slope = = 0.5 Run 8cm 8cm = 16cm 16cm
Step Count Technique Count the number of steps going from left to right.
2 5 5 m = 2
-5 -5 m = 2 2
X Y (4,1) 6 3 2 -2 -3 -4 -3 -2 -1 1 2 3 4 4 4 m = 6 (-2,-3) 2 = 3
Another way to get 2/3, is to use the following formula… m = y2 – y1 x2 – x1 Where (x1,y1) and (x2,y2) simply represent any points on the plane.
X Y (x1, y1) (4,1) 6 3 2 -2 -3 -4 -3 -2 -1 1 2 3 4 -3 - 1 4 m = -2 - 4 (-2,-3) -4 2 (x2, y2) = = -6 3
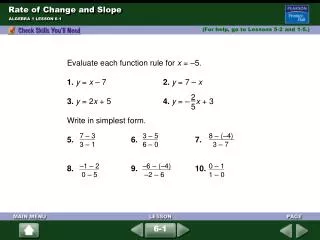
Find the slope of a line that passes through the points A (1,4) and B (4, -2) Use the equation: m = y2 – y1 x2 – x1
Determine the slope: A( 1, 4 ) B( 4, -2) x1, y1 x2, y2 m = -2 – (+4) 4 - 1 m = -6 m = -2 3
First Differences Be sure to copy down all the text in black. All the colored text is just for reading and reflecting
Imagine a snake skimming across the water (click on skimming above) If you were told that the snake was swimming at 2 m/s, you could write an equation (d = 2t) (where d = distance and t = time) To determine if the relationship was linear or not, we could make a graph…. There is a quicker way. Make a Table of Values
Add a First Differences Column to your chart 0 2 2 – 0 = 2 When the FDs are the same, the relationship is linear 4 4 – 2 = 2 6 6 – 4 = 2 8 8 – 6 = 2
Imaginejumpingout of an airplane (click on jumping above) As the skydiver falls towards the mountain, he travels faster and faster. This is true for all objects that fall towards the surface of the Earth. This relationship of speed vs time is easy to understand. Obviously, the skydiver speeds up as time passes. (Can you imagine skydiving at the same slow speed the entire time? Kind of boring….
This relationship can also be modelled with a TOVs.The acceleration due to gravity on Earth is 9.8m/s2This leads to the following chart
Add a First Differences Column to your chart 0 10 10 – 0 = 10 When the FDs are not the same, the relationship is non linear 40 40 – 10 = 30 90 90 – 40 = 50 160 160 – 90 = 70
Use a TOVs with a FD column to determine if the following relationship is linear or not. In summary FDs are the same, then linear FDs are different, then non-linear
0 2 3 9 19
Page 284 1 - 13