Download
1 / 1
30 likes | 236 Vues
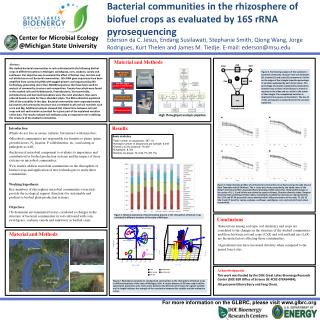
DNA extraction 2 g of soil. Chatham. Bacterial communities in the rhizosphere of biofuel crops as evaluated by 16S rRNA pyrosequencing. CxS. 1. Lake City. Soil. Crop. P. UP/Rose Township. 0.4. K. 12.8. 2.1. 0.7. K. 0.2. East Lansing. pH. Rose Twp.

E N D
DNA extraction 2 g of soil Chatham Bacterial communities in the rhizosphere of biofuel crops as evaluated by 16S rRNA pyrosequencing CxS 1 Lake City Soil Crop P UP/Rose Township 0.4 K 12.8 2.1 0.7 K 0.2 East Lansing pH Rose Twp PCR with tagged primers for the 16S RNA gene 187 km 0 0.0 Salts 21.5 CxL LxS East Lansing/Lake City 2.9 -6.5 RDA2 6.35% NO3- Ca -0.2 pH P Org. matter Location -0.4 Salts NH4+ Trees -1 3.5 0.8 -0.6 0.6 63% UP native veg. 0.6 0.4 Ca 0.4 Gel extraction and PCR product clean-up -0.8 0.2 NO3- 0.2 Center for Microbial Ecology @Michigan State University NH4+ OM 0.0 RDA3 4.38% -0.6 -0.4 -0.2 0.0 0.2 0.4 0.6 Ederson da C. Jesus, Endang Susilawati, Stephanie Smith, Qiong Wang, Jorge Rodrigues, Kurt Thelen and James M. Tiedje. E-mail: ederson@msu.edu 0.0 Unexplained RDA2 6.35% -0.2 -0.2 RDA1 17.54% -0.4 -0.4 -0.6 -0.6 -0.8 -0.8 Trees -0.8 -0.6 -0.4 -0.2 0.0 0.2 0.4 0.6 0.8 East Lansing RDA1 17.54% 454 pyrosequencing Lake City Chatham (UP) Rose Township Material and Methods Figure 3. Partitioning analysis of the variation in bacterial community structure into soil attributes (S), location (L) and crops (C) components. Circles on the edges of the triangle show the percentage of variation explained by each factor alone. The percentage of variation explained by interactions between two or three of the factors is shown as squares on the sides and as a circle in the center of the triangle. The unexplained variation is depicted in the square on the bottom. The size of circles and squares is proportional to the variance explained. • Acknowledgments • This work was funded by the DOE Great Lakes Bioenergy Research Center (DOE BER Office of Science DE-FC02-07ER64494); • JGI personnel (Kerry Barry and Feng Chen). • Abstract • We studied bacterial communities in soils cultivated with the following biofuel crops in different locations in Michigan: switchgrass, corn, soybean, canola and sunflower. Our objective was to evaluate the effect of biofuel crop, location and soil attributes on soil bacterial communities. 16S rRNA gene sequences have been amplified from community DNA with tagged-primers and sequenced by 454 technology, generating more than 300,000 sequences that have been used for analysis of community structure and composition. Twenty-four phyla were found in the studied soils and Acidobacteria, Proteobacteria, Verrucomirobia, Actinobacteria and Gemmatimonadetes were the most abundant. Sites were ordered based on data for these abundant phyla. The RDA ordination explained 24% of the variability in the data. Bacterial communities were separated mainly by location and community structure was correlated to pH and soil nutrients such as Ca and Mg. Additional analysis showed that interactions between soil and crops and soil and location accounted for a great part of the explained variation of the data. The results indicate soil attributes play an important role in defining the structure of the studied communities. • Interactions among soil type, soil chemistry and crops are correlated to the changes in the structure of the studied communities and those between soil and crops (CxS) and soil and land use (LxS) are the main factors affecting those communities; • Agricultural sites have increased diversity when compared to the paired forest sites. High throughput analysis pipeline b) a) Introduction • Plants do not live in axenic cultures, but interact with microbes; • Microbial communities are responsible for benefits to plants (plant growth factors, N2 fixation, P solubilization, etc.) and acting as pathogens as well; • Inclusion of microbial component to evaluate its importance and contribution for biofuel production systems and the impact of those systems on microbial communities; • Few studies address microbial communities in the rhizosphere of biofuel crops and application of new technologies to study these communities. Working hypothesis: Key members of rhizosphere microbial communities (structure) provide the ecological support (function) for sustainable and productive biofuel plant production systems. Objectives • To determine environmental factors correlated to changes in the structure of bacterial communities in soil cultivated with corn, switchgrass, soybean, canola and sunflower as biofuel crops. . Results • Basic statistics • Total number of sequences: 387,111 • Average number of sequences per sample: 6,049 • Clusters at 3% distance: 19,430 • Singletons: 8,762 • Sample coverage: 72.4-92.7% (86.1%) c) d) Figure 4. Renyi diversity profiles of soil bacterial communities in (a) East Lansing, (b) Lake City, (c) Rose Township and (d) Chatham. The x- and y-axis show, respectively, the alpha value of the Renyi’s formula and their associated Renyi diversity profile values (H). Renyi profile values at the scales of 0, 1, 2 and infinite are related to species richness, Shannon diversity index, Simpson diversity index and Berger-Parker index, respectively. Confidence intervals are represented by the 2.5% and 97.5% percentile values obtained after 100 permutations of the data. FC, SB, SF, SW, C and CT stand for canola, soybean, sunflower, switchgrass, corn and control (forest sites), respectively. Figure 1. Relative abundance of bacterial phyla present in the rhizosphere of biofuel crops cultivated in different locations of the state of Michigan. Conclusions Material and Methods Figure 2. Redundancy Analysis for soil bacterial communities in the rhizosphere of biofuel crops in different locations of the state of Michigan, USA. A cluster distance of 3% was used to define operational taxonomic units. Each vector points to the direction of increase for a given variable and its length indicates the strength of the correlation between this variable and the ordination scores. For more information on the GLBRC, please visit www.glbrc.org