Download
1 / 1
10 likes | 141 Vues
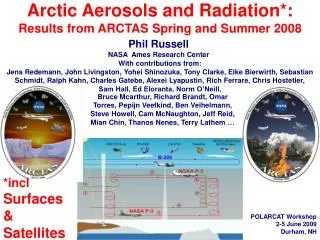
Transport to sink regions. t =. Apply climatological mean (224 Tg yr -1 ) post-1998. 547. Biogenic and biomass burning from Horowitz et al . [2003]. 547. 548. 557. Tg CH 4 yr -1. Tg CH 4 yr -1. Anthropogenic ( energy , rice , ruminants ) from EDGAR 2.0

E N D
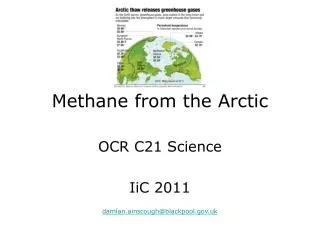
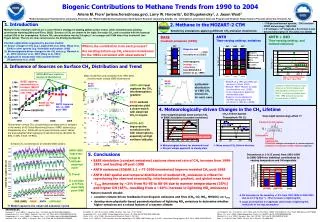
Transport to sink regions t = Apply climatological mean (224 Tg yr-1) post-1998 547 Biogenic and biomass burning from Horowitz et al. [2003] 547 548 557 Tg CH4 yr-1 Tg CH4 yr-1 Anthropogenic (energy, rice, ruminants) from EDGAR 2.0 [Olivier et al., 1999] ANTH+BIO best captures measured abundances 100 50 0 -50 -100 BASE ANTH ANTH+BIO Mean model bias and correlation with 1990-2004 monthly mean surface GMD observations 1990 1995 2000 80 60 40 20 0 BASE ANTH ANTH+BIO Bias (ppb) ANTH+BIObest captures the CH4 interhemispheric gradient BASE too low post-1998 ANTHimproves CH4 vs. OBS post-1998 Tg CH4 yr-1 OBSERVED 1.0 0.8 0.6 0.4 0.2 0.0 -0.2 BASE wetland emissions yield a closer match with observed CH4 in tropics -90 -50 0 50 90 Latitude r2 ANTH+BIO improves the correlation with with observations, especially at high northern latitudes -90 -50 0 50 90 Latitude 1900 1850 1800 1840 1820 1800 1780 1760 1740 1800 1750 1700 1740 1720 1700 1680 1660 1640 Temperature Humidity Lightning NOx Photolysis (changes in stratospheric O3 columns neglected) Changes in emissions of other species (neglected) Alert (82.4N,62.5W) • ANTH+BIO • improves: • high N • latitude • seasonal • cycle • 2) Trend • 3) Low bias • at S Pole, • especially • post-1998 Midway (28.2N,177.4W) Mahe Island (4.7S,55.2E) Change in mean (t) from 1990-1995 to 2000-2004 (years) + = South Pole (89.9S,24.8W) 1990 1995 2000 2005 DT(+0.3K) DOH(+1.4%) BASE Biogenic Contributions to Methane Trends from 1990 to 2004 Arlene M. Fiore1 (arlene.fiore@noaa.gov), Larry W. Horowitz1, Ed Dlugokencky2, J. Jason West3 1NOAA Geophysical Fluid Dynamics Laboratory, Princeton, NJ 2NOAA Global Monitoring Division, Earth System Research Laboratory, Boulder, CO 3Atmospheric and Oceanic Sciences Program and Woodrow Wilson School, Princeton University, Princeton, NJ 1. Introduction • ~100 gas and aerosol species, ~200 reactions • NCEP meteorology 1990-2004 • 1.9o latitude x 1.9o longitude x 64 vertical levels • detailed description in Horowitz et al. [2003] 2. Methane in the MOZART-2 CTM Methane (CH4) emission controls are a cost-effective strategy for abating global surface ozone, while simultaneously slowing greenhouse warming [West and Fiore, 2005]. Sources of CH4 are shown to the right; the major CH4 sink is reaction with the hydroxyl radical (OH) in the troposphere. Surface CH4 concentrations rose by 5-6 ppb yr-1 on average until 1999 when they leveled off (see Figure below). There is no clear consensus on the driving mechanism. Sensitivity simulations applying different CH4 emission inventories: ANTH + BIO Time-varying anthrop. and wetland emissions ANTH Time-varying anthrop. emissions BASE Constant emissions (1990) • Possible explanations suggested by previous studies: • Source changes of CH4 [e.g. Langenfelds et al., 2002; Wang et al., 2004] or other species [e.g. Karlsdóttir and Isaksen, 2000] • Meteorologically-driven changes in the CH4 sink [e.g.Warwick et al., 2002; Dentener et al., 2003; Wang et al., 2004] • Approach to steady-state with constant lifetime • [Dlugokencky et al., 2003] What is the contribution from each process? Are existing bottom-up CH4 emission inventories for the 1990s consistent with observations? Tg CH4 yr-1 3. Influence of Sources on Surface CH4 Distribution and Trend BASEcaptures observed rate of increase1990-97 and leveling off after 1998 • EDGAR v3.2 1990 and 1995 anth. • emissions [Olivier, 2002] • EDGAR “FAST-TRACK” for 2000 • [van Aardenne et al., 2005] • Linear interpolation applied for • intermediate years • Biogenic source adjusted to • maintain same global total • emissions in 1990 as in BASE Latitudinal distribution of 1990 CH4 emissions for each case Combine wetland emissions from Wang et al. [2004] (above) and anthropogenic emissions from ANTH, constraining global mean 1990-1998 wetland emissions to equal those in ANTH nmol/mol = ppb in dry air 4. Meteorologically-driven Changes in the CH4 Lifetime CH4 Lifetime Against Tropospheric OH (t) Area-weighted global mean surface CH4 in BASE simulation (constant emissions) How might meteorology affectt? Global mean surface CH4 concentrations as measured (or sampled in the model) at 42 Global Monitoring Division (GMD) stations [e.g.Dlugokencky et al., 2005] with an 8-year minimum record. Values are area-weighted after averaging in latitudinal bands (60-90N, 30-60N, 0-30N, 0-30S, 30-90S). 10.40 10.23 Recycled NCEP 1990-2004 Surface CH4 concentrations at selected GMD stations • Meteorological drivers for observed trend • Not just simple approach to steady-state • Mean annual CH4 lifetime shortens 5. Conclusions Deconstruct Dt (-0.17 years) from 1991-1995 to 2000-2004 into individual contributions by varying temperature and OH separately • BASE simulation (constant emissions) captures observed rate of CH4 increase from 1990-1997, and leveling off post-1998 • ANTH emissions (EDGAR 3.2 + FT-2000 inventories) improve modeled CH4 post-1998 • ANTH+BIO spatial and temporal distribution of wetland CH4 emissions is critical for reproducing the observed seasonality, interhemispheric gradient, and global mean trend • tCH4 decreases by ~2% from 91-95 to 00-04 due to warmer temperatures (35%) and higher OH (65%, resulting from a ~10% increase in lightning NOx emissions) Future research should: • consider climate-driven feedbacks from biogenic emissions and fires (CH4, CO, NOx, NMVOC) on tCH4 • develop more physically-based parameterizations of lightning NOx emissions to determine whether • higher emissions are a robust feature of a warmer climate nmol/mol = ppb in dry air OH increases in the model by +1.4% from 1991-1995 to 2000-2004 due to a 0.3 Tg N yr-1 (~10%) increase in lightning NOx Large uncertainties in magnitude (and trend) of lightning NOx emissions in the real atmosphere OBS (GMD) BASE ANTH ANTH+BIO Model captures the observed seasonal cycles REFERENCES Dentener, F., et al. (2003), J. Geophys. Res., 108, 4442, doi:10.1029/2002JD002916. Dlugokencky, E.J., et al. (2003), Geophys. Res. Lett., 30, 1992, doi:10.1029/2003GL018126. Dlugokencky, E.J., et al. (2005), J. Geophys. Res., 110, D18306, doi:10.1029/2005JD006035. Horowitz, L.W., et al. (2003), J. Geophys. Res., 108, 4784, doi:10.1029/2002JD002853. Karlsdóttir, S., and I.S.A. Isaksen (2000), Geophys. Res. Lett., 27 (1), 93-96. Langenfelds, R.L., et al. (2002), Global Biogeochem. Cycles, 16, 1048, doi:10.1029/2001GB001466. Olivier, J.G.J., et al. (1999), Environmental Science & Policy, 2, 241-264. Olivier, J.G.J. (2002) In: "CO2 emissions from fuel combustion 1971-2000", 2002 Edition, pp. III.1-III.31. International Energy Agency (IEA), Paris. ISBN 92-64-09794-5. van Aardenne, J.A., F. Dentener, J.G.J. Olivier and J.A.H.W. Peters (2005), The EDGAR 3.2 Fast Track 2000 dataset (32FT2000). Wang , J.S., et al. (2004), Global Biogeochem. Cycles, 18, GB3011, doi:10.1029/2003GB002180. Warwick, N.J., et al. (2002), Geophys. Res. Lett., 29 (20), 1947, doi:10.1029/2002GL015282 West, J.J. and A.M. Fiore (2005), Environ. Sci. & Technol., 39, 4685-4691.