Download
1 / 22
220 likes | 405 Vues
Compensation: Benefits, wages, taxes. Employee Benefits as a Percent of Compensation. TABLE 5.3 Employee Benefits as a Percentage of Total Compensation, 1999 (Average Yearly Cost in Parentheses). Characterization of Market.

E N D
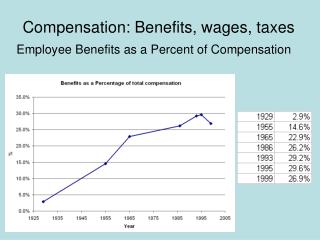
Compensation: Benefits, wages, taxes Employee Benefits as a Percent of Compensation
TABLE 5.3 Employee Benefits as a Percentage of Total Compensation, 1999 (Average Yearly Cost in Parentheses)
Characterization of Market Indifference curve: Combinations of benefits and wages that yield the same level of utility Isoprofit line: Combinations of benefits and wages that yield the same level of profit
Applications Cafeteria Plan Profit sharing vs. Wages Diversification Employee Stock Ownership Plans (ESOP) Polaroid employees give up 8% of salary for ESOP Stock valued as high as $60, closes at $.09 in 2001.
JDI: Job Descriptive Index; MSQ: Minnesota Satisfaction Questionnaire Source: Heneman, Schwab, Fossum and Dyer, Personnel and Human Resource Management, 1989.
Applications Pay for performance ~14% of compensation Commissions Piece work Bonuses Piece rate workers earn more than straight time paid workers Does this mean piece rates motivate? Why aren’t piece rates more common?
Performance bonds and deferred compensation WAGE MRP Deferred compensation BOND
Performance bonds and deferred compensation L = value of leisure W = Wage = MRP if don’t shirk T*
Performance bonds and deferred compensation Return from shirking: At time T*: L+W if shirk and are not caught: Shirk if L + (1-P)*W > W : L if shirk and are caught If P < 1, shirk at T* : W if don’t shirk P = probability of being caught shirking L W T*
Performance bonds and deferred compensation More generally: return from shirking: PV(W) = present value of wage stream PV(L) = present value of leisure consumption Shirk if PV(L) + (1-P)*PV(W) > PV(W) or PV(L) > P*PV(W) L W T*
Performance bonds and deferred compensation Shirk if PV(W) or PV(L) > P*PV(W) As time T*, PV(W) gets smaller relative to PV(L) which means people will start to shirk, which means that true MRP will be less than W L W = MRP without shirking MRP with shirking T*
Performance bonds and deferred compensation Make sure PV(W) = PV(MRP) Rationale for Mandatory retirement WAGE MRP without shirking Deferred compensation BOND T*
Applications Defined Benefit Pension Plans Employee Retirement Income Security Act (ERISA) Pension guaranteed by the Pension Benefit Guarantee Corporation Pension underfunding PBGC at risk for insuring $450 billion of underfunded private pensions Current public sector underfunding $700 billion (more than all state and local property, sales and corporate tax)
Who Made the Biggest Bucks? Wall Street Journal April 10, 2006 Richard D. Fairbank, Capital One Financial Corp $249.27 Shareholder return: 2.7%. Bruce Karatz, KB Home, $155.9 million. Shareholder return: 61%. Henry R. Silverman, Cendant Corp., $133.26 million. Shareholder return: -21%. Richard S. Fuld Jr., Lehman Brothers Holdings Inc., $104.4 million. Shareholder return: 51.6% William E. Greehey, Valero Energy Corp., $95.16 million. Shareholder return: 128.5%. Ray R. Irani, Occidental Petroleum Corp., $83.96 million. Shareholder return: 38.8%. Lawrence J. Ellison, Oracle Corp., $74.37 million. Shareholder return: 12.3%.
Firm 1 CEO $200,000*1 Exec VP $150,000*6 VP $100,000*12 Total $2,300,000 Expected Value of competing VP to EVP = .5*50,000 = $25,000 EVP to CEO= .167*50,000 = $8,333 Firm 2 CEO $560,000*1 Exec VP $130,000*6 VP $80,000*12 Total $2,300,000 Expected Value of competing VP to EVP = .5*50,000 = $25,000 EVP to CEO= .167*430,000 = $71,810 Tournaments Why bother?
Firm 1 CEO $200,000*1 Exec VP $150,000*6 VP $100,000*12 Total $2,300,000 Expected Value of being VP = 100,000 + .5*150,000 + (.5)*(.167)*200,000 = $191,700 Expected gain from competing = $91,700 Firm 2 CEO $560,000*1 Exec VP $130,000*6 VP $80,000*12 Total $2,300,000 Expected Value of being VP = 80,000 + .5*130,000 + (.5)*(.167)*560,000 = $176,760 Expected gain from competing = $96,760 Tournaments
Forbes Magazine CEO Survey of the 800 largest publicly held firms Of 800 CEOs 26 Founders Of 774 firms not run by founders 694 (90%) internal promotions 80 (10%) external hires
Tournaments Why should you have larger raises as job level rises? • Probability of promotion gets smaller • Number of future contests decreases No further option for CEO except moving to bigger firm