Download
1 / 123
1.23k likes | 1.39k Vues
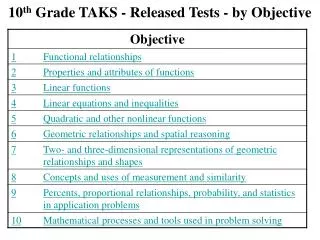
Objective 1…TAKS 10 th and 11 th grades Home slide. Home. TAKS questions from released tests, study guides and information booklet:. Safety, measurement, correct choice of equipment. Interpreting graphs and illustrations. Analyzing promotional labels and ads. The Scientific Method.

E N D
Objective 1…TAKS 10th and 11th grades Home slide Home TAKS questions from released tests, study guides and information booklet: Safety, measurement, correct choice of equipment Interpreting graphs and illustrations Analyzing promotional labels and ads The Scientific Method Links to non-TAKS tutorials and quizzes Link to 10th grade study guide Scroll to p.251 for objective 1 Link to 11th grade study guide Scroll to p.297 for objective 1
Home Non-TAKS tutorials & quizzes
Home Safety/Measurements/Equipment choices Back to safety, etc • Understanding safety precautions • Reading measurements • Choosing equipment
A science class is conducting an experiment that produces noxious fumes. Because of inadequate ventilation, some students begin to feel nauseated and dizzy. The first response should be to — A neutralize the acid that is reacting to produce the noxious fumes B carry the reactants outside, away from other students C leave the room and go to an area with fresh air D spray the reaction with a fire extinguisher Home Back to safety, etc 55
The safest way to dilute concentrated sulfuric acid is to add A a series of small volumes of water to the acid while stirring B the acid to water slowly while stirring constantly C the acid to a small volume of water and then add more water D dilute sulfuric acid to a small volume of the concentrated acid Home Back to safety, etc 1
Acids must be handled with extreme care. You will be shown the proper method for diluting strong acids. Always add acid to water, swirl or stir the solution and be careful of the heat produced, particularly with sulfuric acid. Home Back to safety, etc AW WA
Laboratory equipment is cleaned and properly stored after use primarily so that — A chemical products can be measured and recorded as data B time is saved in setting up the next experiment C toxic materials can be kept in the laboratory D the possibility of contamination in the laboratory is minimized Home Back to safety, etc A clean lab prevents accidents, contamination and worry. 55
The reason forwafting or fanning a small amount of chemical vapors toward the nose as a means to detect odors in a test tube is to — A avoid experimental error from excessive loss of mass of reactants or products B avoid splashing chemicals into the face of any person C protect the respiratory tract against potentially harmful vapors D determine the relative strength of the odor before smelling directly Home Back to safety, etc 15
Home Back to safety, etc Reactions that produce toxic gases should be performed in a — A laboratory fume hood B beaker with a watch glass on top C well-ventilated area of the lab D warm, airtight drying oven 15
All of these procedures must be followed when using the setup shown except — A putting on safety goggles B handling the beaker with tongs C securing loose clothing D wearing rubber gloves Always wear goggles when using glassware, heat/fire and chemicals. And always secure loose clothing and hair. Home Back to safety, etc Latex, rubber gloves would melt. Cotton gloves handle heated glassware. 9
Home Back to safety, etc A safety checklist for this activity should include the presence of a proper fire extinguisher and all the following items except a — A fire blanket B receptacle for broken glass C laboratory apron D squeeze bottle Lab aprons are used when there is fire and/or chemicals in use. 35
Home Back to safety, etc The ingredients described above are used to make a bonding agent. The most important safety precaution to take when applying this bonding agent is to — F dry it with a small flame G work in a well-ventilated area H cover the work area with newspaper J wear a lab coat 2
Home Back to safety, etc Classification symbols for certain fire extinguishers are shown below. Which class of fire extinguisher should be used when a hot plate overheats and catches on fire? 24
Home Back to safety, etc
Home Back to safety, etc Assume all unknown materials are toxic until finding out differently. Which safety precaution should be observed while analyzing sediment from a marine aquarium? A Wear rubber gloves B Use a fume hood C Avoid using glassware D Have a fire extinguisher nearby 15
Home Back to safety, etc Which of the following shows the length of a rubber strip measured precisely to 2.22 centimeters? – 7
Home Back to safety, etc
Home Back to safety, etc 47 – 38 = 9 mL The illustration shows volume levels of a liquid in a graduated cylinder before and after a sample was removed. According to this information, what was the volume of the sample to the nearest milliliter? Record and bubble in your answer on the answer document. 20
Home Back to safety, etc What is the volume reading for the solution in the pipette? A 19.4 mL B 19.6 mL C 20.4 mL D 20.6 mL 55
Four lab groups measured the volume of acid required to neutralize a standard solution of sodium hydroxide base. Which of the groups measured the volume with the highest precision? Home Back to safety, etc Use the skinniest thing with lines on it. Acid Base Acid Base Acid Base 13 Acid Base
Home Back to safety, etc Which of the following procedures should be used in finding the mass of crystals? A Pour the excess crystals back into the original container B Put the crystals on the outer part of the balance pan for massing C Pour wastes down the sink with plenty of water D Use weighing paper on the balance pan Never put chemicals back into the original container. They might be contaminated. Put crystals in the center of the pan not “outer”. Unrelated to the question of massing. 25
Which of the following will allow measurement of a liquid’s volume with the greatest precision? A 50 mL cylinder graduated in 1 mL increments B 100 mL cylinder graduated in 0.5 mL increments C 100 mL cylinder graduated in 1 mL increments D 200 mL cylinder graduated in 5 mL increments Home Rule: Choose a ‘skinny’ glassware. Choose the cylinder with the most lines on it, and the smallest subparts for precision. Back to safety, etc 50 ÷ 1 = 50 lines 1 ml subpart 100 ÷ 0.5 = 200 lines 1/2 ml subpart 100 ÷ 1 = 100 lines 1 ml subpart 200 ÷ 5 = 40 5 ml subpart 21
Home Back to safety, etc 25.29 - 24.51 = .78 25.50 - 24.49 = 1.01 25.92 - 24.99 = .93 25.03 - 24.98 = .05 S Q Subtract the lowest number of the range from the highest number in each row. R T
The table shows four mass readings of one object as measured by four different balances. Which balance produced the most-consistent measurements? A Q B R C S D T Home Back to safety, etc 19
Range = 11.5 – 5.6= 5.9 Home Range = 9.8 – 8.2= 1.6 Range= 11.8 – 10.5= 1.3 Range = 11.9 – 10.2 = 1.7 Back to safety, etc These data were gathered by four groups of students. Each group performed four trials to determine the acceleration rate of a toy car. Which group had the most-consistent data? F Group Q G Group R H Group S J Group T 16
10 mL Home Back to safety, etc Which of these will give the most precise measure of a 10-milliliter volume? Rule: You use the smallest and skinniest device with lines on it. 22
Which of the following pieces of equipment would be most appropriate for measuring the volume of a marble? Home Back to safety, etc Not precise for a marble Marble displacement of water Marble mass Marble diameter 35
Home Back to safety, etc Which set of equipment would be best to use to test the effect of temperature on solution acidity? F A balance and a thermometer G A pH meter and a barometer H A balance and litmus paper J A thermometer and a pH meter 50
Home Back to safety, etc Rule: at least double the size of the container for the amount of liquid boiling. Rule: don’t seal or close a container when boiling. Which lab setup would be appropriate to use in heating 100 mL of water to the boiling point? A A 10 mL test tube held above a Bunsen burner B A 200 mL beaker placed on a hot plate C A thermal coil inside a 100 mL cylinder D A sealed 300 mL flask in a warm-water bath 5
Home Back to safety, etc
Interpreting graphs & illustrations Home Back to graphs To: Reading maps and illustrations To: Interpreting graphs To: Interpreting charts
Home Back to graphs 100 200 200 200 km The cloud conditions above are typical of locations near a warm front. According to these data, what are the most likely sky conditions for Waco? A Cirrus clouds B Altostratus clouds C Stratus clouds D Clear skies 45
Home Back to graphs
Home Back to graphs
At which temperature do KBr and KNO3 have the same solubility? A 27°C B 48°C C 65°C D 80°C Home Back to graphs 51
According to the graph, about how much hemoglobin would be saturated at an O2 pressure of 7.3 kPa? A 32% B 67% C 89% D 92% Home Back to graphs 49
Home Back to graphs
The graph shows the percentage of hemoglobin that combines with carbon monoxide (CO) at various concentrations. Exposure to 400 parts per million of CO in air can cause people to experience nausea and a throbbing headache. According to the graph, about what percentage of hemoglobin is bound to CO at a CO concentration of 400 parts per million? A 25% B 35% C 40% D 55% Home Back to graphs 55
Home Back to graphs The graph shows the distance traveled by a vehicle over a certain period of time. Which segment of the graph shows the vehicle moving with the greatest speed? A L B M C N D O The steeper the line, the faster the speed. Horizontal lines “M” mean “parked” or no speed. 39
Home Back to graphs 1 m per 1 sec According to this graph, what was the bicycle’s acceleration between 6 and 10 seconds? A 0.0 m/s 2 B 0.65 m/s 2 C 1.6 m/s 2 D 6.5 m/s 2 He was staying still for a while. 2 m per 1 sec 41
Home Back to graphs
According to the graph, what is the approximate half-life of carbon-14? A 5.7 years C 23,000 years B 5,700 years D 1,000,000 years Home Back to graphs 100% ½ of 100% 49
Which graph illustrates the progress of a chemical reaction in which energy is released? Home Back to graphs
According to this information, what is the best prediction for the boiling point of the seven-carbon alcohol? A 169°C B 178°C C 186°C D 192°C Home Back to graphs 47
The graph shows the results of a study testing chemical pesticides on a pest species common to cotton plants. Different chemical pesticides were used in five different areas. According to these results, which of the following is the most effective chemical for controlling this pest species? A R B S C T D V Home Back to graphs A lot Pests that stayed alive: Pests that stayed alive: A few 11
Home Back to graphs The graph shows the amount of carbon-14 in tissue over time. According to the graph, if a bone contains 1/8 the amount of carbon-14 that it did originally, its approximate age is — F 5,700 years G 11,400 years H 17,100 years J 22,800 years 6
Which graph best shows the comparison of the elements to the total composition of the copper ore? Home Back to graphs Use pie graphs when all the parts make a whole.
Home Back to graphs 47
The graph shows metabolic rates for two types of fish at different environmental temperatures. Which of the following conclusions can be drawn from these data? F Fish metabolism responds to temperature changes. G Metabolic rates decrease as environmental temperatures increase. H Fish body temperature results from high metabolism. J Metabolic rates are independent of environmental temperature. Metabolic rate means ‘rate of burning calories’ Home Back to graphs . Dependent variables are put on the Y axis. So metabolic rate (Y axis) depends on, or responds to temperature (X axis). Independent variables are put on the X axis. 50