
Statistical Analysis Tools: LINREG, Correlate, Box-Jenkins - Explained
Learn how to use LINREG for regression analysis, Correlate for computing correlations, and Box-Jenkins for time series modeling. Understand technical issues, solutions, and transforming series for accurate results.

Statistical Analysis Tools: LINREG, Correlate, Box-Jenkins - Explained
E N D
Presentation Transcript
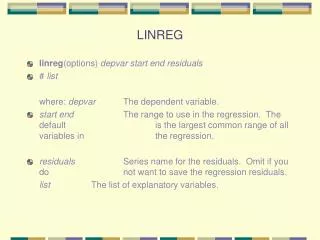
LINREG • linreg(options) depvar start end residuals • # list where: depvar The dependent variable. • start end The range to use in the regression. The default is the largest common range of all variables in the regression. • residuals Series name for the residuals. Omit if you do not want to save the regression residuals. list The list of explanatory variables.
Examples of LIN lin y # constant x lin y 1991:12 2001:8 # constant x lin y 1991:12 2001:8 resids # constant y{1 2 5} lin y / resids # constant y{1 to 4}
Internal Variables • LINREG creates a number of variables that you can use in subsequent computations. A partial list of these variables is: • %BETA The coefficient vector. The first coefficient estimated is %BETA(1), the second %BETA(2), and so on. For example, in the output for dlja above, the constant is %BETA(1), the coefficient for dlja{1} is %BETA(2), and so forth. • %tstats The vector of t-stats • %NDF Degrees of freedom. • %NOBS Number of observations. • %NREG Number of regressors. • %RSS Residual sum of squares. • %RSQUARED Centered R2 (i.e, the usual measure of R2) • %SEESQ Standard error of estimate squared
Correlate Correlate(options) series start end (saveseries) • where: series The series used to compute the correlations. • Results= series used to save the correlations • NUMBER= The number of autocorrelations to compute. The default is the integer value of one-fourth the total number of observations. • PARTIAL= Series for the partial autocorrelations. If you omit this option, the PACF will not be calculated. • QSTATS Use this option if you want the Ljung-Box Q-statistics. • SPAN= Use with qstats to set the width of the intervals tested. For example, with quarterly data, you can set span = 4, to obtain Q(4), Q(8), Q(12), and so forth.
The AIC and the SBC com sbc = nobs*log(%rss) + %nreg*log(%nobs) compute aic = %nobs*log(%rss) + 2*%nreg display 'AIC' aic 'SBC' sbc
BOXJENK • BOXJENK depvar start end residuals • Options • AR=number of autoregressive parameters [0] • MA=number of moving average parameters [0] • iters= number of iterations • SAR=number of seasonal autoregressive parameters [0] • SMA=number of seasonal moving average parameters [0] • DIFFS=number of regular differencings [0] • SDIFFS=number of seasonal differencings [0] • CONSTANT/[NOCONSTANT]
Technical Issues • Constant in the equation • box(constant, ar=||1,4||, ma = 2) y • Negative values of the aic and bic • aic = T ln(%rss) + 2*%nobs • To use the aic and bic, the models must be estimated over the same sample period. • box(constant, ar=||1,4||, ma = 2) dly 90:1 * • box(constant, ar=1, ma = 2) dly 90:1 *
Technical Issues 2 • Did not converge error message • The program cannot find the solution for the coefficients that minimizes the residual sum of squares. • increase iters • iters=50 • The model is too complex (too unnecessary many parameters)
Transforming the series • When to difference? • When to use the log? • Graph the transformed series • Check ACF of the transformed series
The ACF • Label the graph of the autocorrelations • Alter bjident.src • Write in the essential details • plot the correlations yourself • ACF of the residuals
Bjident @BJIDENT series start end • Options • DIFF=maximum regular differencings[0] • SDIFFS=maximum seasonal differencings[0] • TRANS=[NONE]/LOG/ROOT • Transformation to apply to data • [GRAPH]/NOGRAPH • SPAN=seasonal span
Forecast forecast(print) number steps start # equation forecasts number The number of equations in the system. In univariate forecasting, number is necessarily equal to 1. steps The number of forecasts to create. start The starting period of the forecasts. equation The name of the previously defined equation. forecasts The name of the series in which you want to save the forecasts. This field is optional. Example boxjenk(define=eq1,ar=1,ma=1) y / resids forecast(print) 1 5 101 # eq1
Forecast -- New FORECASTequations • # equation forecasts • FROM=starting period of the forecast interval • TO=ending period of the forecast interval • STEPS=number of forecast steps to compute • • FROM and TO set the starting and ending periods for the forecasts, or • • FROM and STEPS to set the starting date and number of steps (periods) • PRINT/[NOPRINT]
Seasonality in the Box-Jenkins framework • Seasonal AR coefficients • yt = a1yt-1+a12yt-12 + a13yt-13 • yt = a1yt-1+a12yt-12 + a1a12yt-13 • (1 - a1L)(1 – a12L12)yt • Seasonal MA Coefficients • Seasonal differencing: = yt – yt-12
Seasonality in the Box-Jenkins framework • Seasonal AR coefficients • yt = a1yt-1+a12yt-12 + a13yt-13 • yt = a1yt-1+a12yt-12 + a1a12yt-13 • (1 - a1L)(1 – a12L12)yt • Seasonal MA Coefficients • Seasonal differencing: • Dyt = yt – yt-1 versus D12yt = yt – yt-12 • NOTE: You do not difference 12 times • dif(sdiffs=1) y / sdy