Body Composition
Body Composition. Chapter 6. What is Body Composition?. Body composition = the body’s relative amounts of fat mass and fat-free (Lean) mass (bone, water, muscle, connective and organ tissues, teeth)


Body Composition
E N D
Presentation Transcript
Body Composition Chapter 6
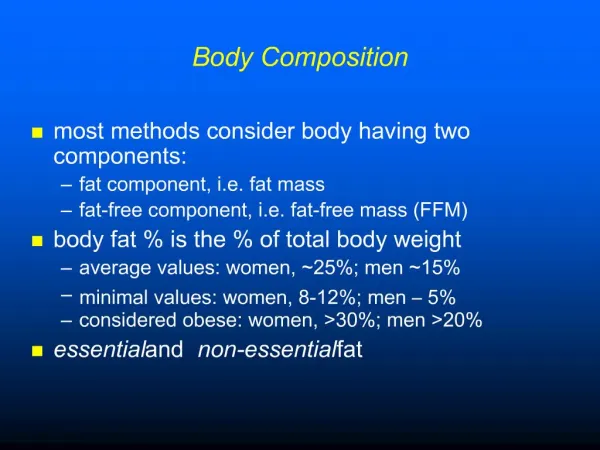
What is Body Composition? • Body composition = the body’s relative amounts of fat mass and fat-free (Lean) mass (bone, water, muscle, connective and organ tissues, teeth) • Essential fat = crucial for normal body functioning. Includes lipids incorporated into nerves, brain, heart, lungs, liver and mammary glands. • These are crucial for normal body functioning • 3–5% of total body weight in males • 8–12% of total body weight in females • Nonessential fat= adipose tissue. Fat that has accumulated in adipose tissue surrounding organs and subcutaneously. • Amount varies with each individual
The Facts • Americans are among the heaviest people in the world and we just keep getting heavier! • Related to decreased physical activity and increased caloric consumption. • More than half of all Americans do not get the minimum recommended 30 minutes per day of moderate physical activity. • Increase of MORE THAN 500 calories/daybetween 1970 and 2003. • If you consume 200 extra calories/day, that equates to a 20lb. weight gain/year.
Overweight and Obesity • The most important consideration in evaluating body weight and composition is the proportion of total body weight that is fat (percent body fat) • Using a scale and height/weight charts only determines total body weight, not how much of that weight is bone, fat, and muscle. • Overweight = total body weight above a recommended range for good health, weighing 10% or more over recommended weight • A BMI of 25-29.9 (Natl. Institute of Health) • Obesity = severely overweight and overfat; characterized by excessive accumulation of body fat, weighing 20% or more over recommended weight • A BMI of 30-39.9 • Extreme Obesity is a BMI of > 40.
Healthy Body Weight • National Institutes of Health • More than 67% of American adults are overweight • More than 32% of American adults are obese • Obesity has doubled since 1960 • At current rates, all American adults will be overweight by 2030
Carol Yager (1960 - 1994) of Flint, MI; 5 ft 7 in, estimated to have weighed more than 1600 lbs at her peak. She had been fat since childhood. In 1993, she was measured at 1189 lbs when admitted to Hurley Medical Center, suffering from cellulitis. She lost nearly 500 lbs on a 1200-calorie diet, but most of that weight was thought to be fluid, and she regained all of it and more soon after being discharged. Her teenage daughter, a boyfriend, and a group of volunteers helped take care of her. Despite extravagant promises by diet maven Richard Simmons and talk-show host Jerry Springer, Yager received little practical assistance in return for her media exposure (though Springer continues to profit from her appearance on his show, having rebroadcast that episode at least four times). She was refused further hospitalization on the grounds that her condition was not critical, despite massive water retention and signs of incipient kidney failure, and these problems led to her death a few weeks later.
Extreme Obesity • The number of extremely obese American adults (100+ lbs. overweight) has quadrupled since the 1980’s. • 4 million Americans or 1 in every 50 adults • Once rare, extreme obesity has surged 2x as fast as less severely obese adults. • Associated with our behaviors – overeating and inactivity!
Obesity • Industry has been forced to create new products to accommodate our increasing size. • Extra large and reinforced car seats • Giant chairs • Super, heavy duty bathroom scales • Toilets rated to 1,500 lbs. • Beds built to accommodate 1,100 lbs. • “Trapeze” used to help people who weigh 1,000 lbs. roll over in bed ~At St. Francis, Peoria, - recently purchased equipment to lift people who weigh up to 800 lbs. – weight previously shouldered by nurses and staff members. ~They also employ 17 people for a “lift team” which responds throughout the hospital to provide lifting assistance, as the patient weighs more than ever before! ~In 2003, St. Francis had 671 patients who weighed more than 400 lbs.
Obesity Trends* Among U.S. AdultsBRFSS, 1986 Source: Mokdad A H, et al. J Am Med Assoc1999;282:16, 2001;286:10.
Obesity Trends* Among U.S. AdultsBRFSS, 1987 Source: Mokdad A H, et al. J Am Med Assoc1999;282:16, 2001;286:10.
Obesity Trends* Among U.S. AdultsBRFSS, 1988 Source: Mokdad A H, et al. J Am Med Assoc1999;282:16, 2001;286:10.
Obesity Trends* Among U.S. AdultsBRFSS, 1989 Source: Mokdad A H, et al. J Am Med Assoc1999;282:16, 2001;286:10.
Obesity Trends* Among U.S. AdultsBRFSS, 1990 Source: Mokdad A H, et al. J Am Med Assoc1999;282:16, 2001;286:10.
Obesity Trends* Among U.S. AdultsBRFSS, 1991 Source: Mokdad A H, et al. J Am Med Assoc1999;282:16, 2001;286:10.
Obesity Trends* Among U.S. AdultsBRFSS, 1992 Source: Mokdad A H, et al. J Am Med Assoc1999;282:16, 2001;286:10.
Obesity Trends* Among U.S. AdultsBRFSS, 1993 Source: Mokdad A H, et al. J Am Med Assoc1999;282:16, 2001;286:10.
Obesity Trends* Among U.S. AdultsBRFSS, 1994 Source: Mokdad A H, et al. J Am Med Assoc1999;282:16, 2001;286:10.
Obesity Trends* Among U.S. AdultsBRFSS, 1995 Source: Mokdad A H, et al. J Am Med Assoc1999;282:16, 2001;286:10.
Obesity Trends* Among U.S. AdultsBRFSS, 1995 Source: Mokdad A H, et al. J Am Med Assoc1999;282:16, 2001;286:10.
Obesity Trends* Among U.S. AdultsBRFSS, 1996 Source: Mokdad A H, et al. J Am Med Assoc1999;282:16, 2001;286:10.
Obesity Trends* Among U.S. AdultsBRFSS, 1997 Source: Mokdad A H, et al. J Am Med Assoc1999;282:16, 2001;286:10.
Obesity Trends* Among U.S. AdultsBRFSS, 1998 Source: Mokdad A H, et al. J Am Med Assoc1999;282:16, 2001;286:10.
Obesity Trends* Among U.S. AdultsBRFSS, 1999 Source: Mokdad A H, et al. J Am Med Assoc1999;282:16, 2001;286:10.
Obesity Trends* Among U.S. AdultsBRFSS, 2000 Source: Mokdad A H, et al. J Am Med Assoc1999;282:16, 2001;286:10.
Obesity Trends* Among U.S. AdultsBRFSS, 2001 Source: Mokdad A H, et al. J Am Med Assoc1999;282:16, 2001;286:10.
Obesity Trends* Among U.S. Adults2004 (*BMI ≥30, or ~ 30 lbs overweight for 5’ 4” person) Source: Behavioral Risk Factor Surveillance System, CDC No Data <10% 10%–14% 15%–19% 20%–24% ≥25% No Data <10% 10%–14% 15%–19% 20%–24% ≥25%
(*BMI ≥30, or ~ 30 lbs overweight for 5’ 4” person) Obesity Trends* Among U.S. AdultsBRFSS, 2005 No Data <10% 10%–14% 15%–19% 20%–24% 25%–29% ≥30% Data from May, 2007
Americans • Since 1960, average weight has ↑ • Adult men -from 166 to 191 lbs. • Adult women – from 140 to 164 lbs.
Height and Weight: Change Over Time Source: Centers for Disease Control and Prevention
Excess Body Fat and Wellness • Increased risk of chronic disease and premature death; associated health problems include • Unhealthy blood fat levels • Impaired heart function • Heart disease and hypertension • Cancer • Impaired immune function • Gallbladder disease • Kidney disease • Skin problems • Sleeping problems • Diabetes • Respiratory Ailments
Diabetes • According to American Diabetes Association, 1 out of every 3 Americans born in 2000 will develop diabetes in their lifetime. • Claimed more than 224,000 lives in 2002. • Heart disease, stroke, liver failure, amputations, HBP and cholesterol are all side effects of diabetes. • Diabetes alone represents 11% of the U.S. health-care expenditure. • As of 2005, 20.8 million people have diabetes.
Health Effects • DIABETES • There is 3 times the rate of diabetes with a obese individual as compared to the non-obese. • Nearly 80% of patients with non-insulin dependent diabetes are obese. • Type I Diabetes – (5-10%) – The pancreas produces little or no insulin, so daily doses of insulin are necessary. • Type II Diabetes – (90%) – Condition can develop slowly and many are unaware of their condition. Either the pancreas does not produce enough insulin or cells are resistant to insulin or both. About 1/3 of people with Type II must inject insulin. • The major factors involved in the development of diabetes are age, obesity, physical inactivity, family history, and lifestyle.
Diabetes: Prevention • Regular physical activity including endurance exercise and weight training • Moderate diet rich in whole grains, fruits, vegetables, legumes, fish, and poultry • Modest weight loss • For people with pre-diabetes, lifestyle changes are more effective than medication in preventing diabetes
Problems Associated with Very Low Levels of Body Fat • Too little body fat is associated with reproductive, circulatory, and immune system disorders • Less than 8–12% for women • Less than 3–5% for men
Female Athlete Triad • A condition consisting of three interrelated disorders
ASSESSMENT OF BODY COMPOSITION • The determination of one’s body composition is valuable in developing a plan for overall health and wellness. • There are several measurements and some are more accurate than others. • Hydrostatic Weighing • Skin-fold Measurements • Bioelectrical Impedance Analysis • BMI • Waist-to-Hip Ratio
Hydrostatic (Underwater) Weighing • Considered the “gold standard” or the most accurate of the indirect methods, by which other methods are validated. • It involves the total submersion of an individual in a specifically designed water tank and weighed. • Based on Archimede’s principal of buoyancy. The percent fat and fat-free mass are calculated from body density. • Muscle tissue has a higher density than water and tends to sink. Fat tissue has a lower density than water and will float. Thus, people who are leaner will tend to sink and weigh more underwater, while those who are fatter will float and weigh less under water. • Accurate measurements require the subject to forcefully exhale as much air from the lungs as possible.
Bod Pod • Consists of a small chamber that contains sensors and measures body composition by air displacement, rather than water displacement. • Much easier and more convenient than UWW.
Estimating Percent Body Fat • Skinfold measurements: Folds of skin are measured with a caliper. The measurements are used in equations that link the thickness of skinfolds to percent body fat calculations made from more precise experiments.
Bioelectrical Impedance Analysis • Predicts body composition by estimating the amount of body water, most of which is found in lean muscle tissue. • Small electrical current is sent through the body. • Water is a good conductor of electricity. Since lean tissue is wet, it will more readily conduct the electrical current. • Fat is dry, therefore, there will be more impedance or resistance to the electrical current. • Easy to administer, but dehydration is a factor with accuracy. Dehydration tends to overestimate % fat.
DEXA and TOBEC • Dual energy X-ray absorptiometry (DEXA) measures the tissue absorption of high- and low-energy X-ray beams. • Total body electrical conductivity (TOBEC) estimates lean body mass by passing the body through a magnetic field.