Download

1 / 40
400 likes | 504 Vues
This study investigates turbulent properties in the Adriatic Sea, crucial for air-sea exchange, weather, and climate. Through microstructure measurements and modeling, the project aims to enhance the understanding of mixing in the upper ocean, surface-driven by winds, waves, and cooling mechanisms. The text provides in-depth information on acquiring measurements, dissipation rates, and eddy diffusivity. Noteworthy results from DART06-A and -B field campaigns are discussed, highlighting different turbulence cases driven by wind, cooling, or convection. Data collected from various sensors such as profilers and CTDs contribute to refining parameterization and assessing turbulent fluxes. The study also emphasizes the significance of grid resolution and model validation for accurate predictions in ocean modeling.

E N D
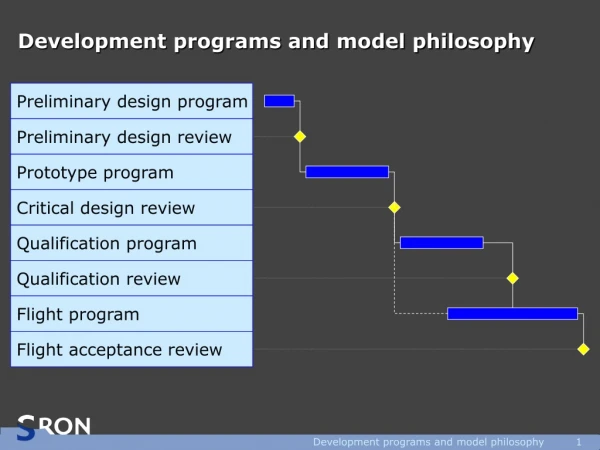
Measurements and (preliminary) Modeling of Turbulent properties in the Adriatic Sea Sandro Carniel – Mauro Sclavo (CNR-ISMAR, Venice) Lakshmi Kantha (Univ. of Boulder, CO, USA) Hartmut Prandke (ISW, Germany) Jacopo Chiggiato (ARPA-SIM, Bologna) ROMS-TOMS European Workshop, November 6-8, 2006
Sub-grid Scale parameterization …WHY?... important to air-sea exchange, weather, climate, biolog. productivity, oil-spill tracking, counter-mine warfare, S&R etc. Mixing in the upper ocean is primarily surface-driven: 1. Momentum flux from winds and waves 2. Negative buoyancy flux due to cooling and evap. Below the active ML: Shear instabilities, Double-diffusion …HOW?... 1) Acquiring microstructure measurements via turbulence profiler 2) Starting from this picture of turbulent parameters, to test and accordingly modify SCM employed in 3-D hydrodynamical models ONR NICOP Grant (N00014-05-1-0759)
DART region ONR NICOP and DART Project 2006: measuring turbulent properties, during the period of DART06 A & B (March and August) 2007: - assessment Turbulence parameterization in 3-D ocean models - other measurements (June) 2008: refinement of parameterization and delivery
Free-falling profiler 2 velocity microstr. Shear sensors 1 microstructure Temp. sensor standard CTD sensors for prec. measurements turbidity (light scattering) sensor vibration control sensor (ACC) surface detection sensor 1024 s.p.s., 16 bit
MSS Profiler The microstructure sensors are placed at the tip of a slim shaft, about 150 mm in front of the CTD sensors. Shear sensor is a piezoceramic beam: if V~sinking velocity, G is sensor gain, Es~signal, du/dz ~ (GV2)-1 dEs/dt TKE dissipation rate TKE Dissipation Rate
Useful Info from Measurements… Dissipation rate for isotropic turbulence: ( water kinemat. viscosity) i.o. =ui/xj (ui/xj + uj/xi) Dissipation rate of microstruct. Temperature variance: (KT molecular diff. for heat in water) Eddy Diffusivity from Diss. Rate: Eddy Diffusivity of Heat:
Meteo Conditions during DART06-B (August 2006) Red= air T Blue= SST March 2006: 252 profiles August 2006: More than 300 profiles, 160 of them at B90 site in 5 days, divided into 5 O.P.
Heat & Buoyancy Fluxes, DART06-B Estimated errors Bulk formulae VS measured turbulent fluxes are easily up to 40%
OP-1 (39 casts, 13.09-15.26 UTC) Weak surface forcings case Weak w, 4.9 m/s Wstar= 1.2 cm/s D=13m > MO=5m LT=0.5 m (RMS of Thorpe displ., length scale of turb. oveturns, i.e. weak mixing) N freq. indicates strong pycnocline U*=(/)1/2 W*=(Jb0D)1/3 MO=U*3/(Jb0) R=(W*/U*)3 T variance diss. rate
OP-2 (24 casts, 17.03-18.48 UTC) Wind-driven case Stronger w, 11 m/s Cooling, -150 W/m2 Wstar= 1. cm/s Ustar=1.3 cm/s (R=0.4, i.e. wind driven) D=13m < MO=60m (large, indicating wind driven case) LT=up to 2 m U*=(/)1/2 W*=(Jb0D)1/3 MO=U*3/(Jb0) R=(W*/U*)3 d
OP-3 (40 casts, 23.29-02.17 UTC) Convection-driven case • Weak w, 3.4 m/s • Clear sky, high cooling, • 200 W/m2 • Wstar=1.1 cm/s • Ustar=0.4 cm/s • (R=20, convection) • D=20m > MO=2.6m • (buoyancy dominated) • LT=3 m (strong • convection mixing) U*=(/)1/2 W*=(Jb0D)1/3 MO=U*3/(Jb0) R=(W*/U*)3 d
March 2006 – late winter (DART06-A) Weak wind (4 m/s) Layered density structure. Double diffusivities convection from cold fresh water masses over warm salty ones?
=c+ s ,z D =i ,z >D good scaling in the ML... Turbulence Scaling: Dissipation rates c=0.58 Jb0 s=1.76 u*3 / z =c+ s Below the ML, i=0.03 L2TN3 …better scaling in the interior
Grid 160 x 60 w/ variable resolution ~ 3 Km (north) ~ 10 Km (south) 20 levels Original resolution: 15 arc seconds (1/240°). Source: data collected during the project ADRIA 02-03 with various contributions from CNR-ISMAR Bologna, CNR-ISMAR Venice, HHI Split, IIM Genova, IRB Zagreb, NIB Piran, NURC La Spezia.
wind 10 m • mean sea level pressure • air temperature 2 m • dew temperature 2 m • total cloud cover • net short-wave radiation LAMI 48 rivers and springs Mediterranean GCM (OPA-MFSTEP) daily forecasted temperature and salinity + tidal elevation and currents (M2,S2,O1,K1) from QUODDY model
ROMS turbulence modeling: March • Resolution 6x6 km or • 2x2 km (running) • - Restart file from operational version ARPA-SIM 6km • TCMs: • GLS as “gen” • GLS as “k-kl” • Wave-breaking • on (6km)/off (2km) • Radiation Stresses • on (one-way, 6km) • via SWAN run
Validation (CTDs Urania) • RMSE suggest: • Similar behaviour as for CTD-Alliance in the SAd and MAd (actually the temperature is a little bit colder compared to observations) • Low errors for temperature in the NAd, salinity fresher by 0.5 PSU • Major errors are located along the WACC
Validation (CTDs Alliance) • RMSE suggest: • Southern Adriatic: AdriaROMS is colder by 1°C and fresher by 0.3 PSU. The two bias cancel each other, and resulting sigma-t is nearly unbiased. • Middle Adriatic: AdriaROMS has a negligible temperature bias but is still fresher by 0.2÷0.3 PSU; the resulting sigma-t is now slightly biased
ROMS turbulence modeling: March 2006 CB wave-breaking on Radiation stresses on via SWAN run NO CB wave-breaking NO radiation stresses 2x2 km 6x6 km
5x5 km 2x2 km ROMS turbulence modeling: March 2006 NO CB Wave-breaking NO Radiation stresses CB wave-breaking on Radiation stresses on via SWAN run 6x6 km 2x2 km
ROMS turbulence modeling: March 2006 CB wave-breaking on Radiation stresses on via SWAN run 6x6 km
ROMS turbulence modeling: March 2006 NO CB wave-breaking NO Radiation stresses 2x2 km
Considerations • Dissipation measurements and data processing have to be carried out carefully to avoid falsification resulting from pseudo shear, sensor bottom hits, high particle conc., strong shear layers and pycnoclines (change of profiler sinking leads to falsified dissipation rates) • Despite this, modern turbulence profilers enable routinely TKE dissipation measurements in marine environment and useful diffusivity estimations • Need of longer „time-series“, i.e. repeated measurements in the same spot (intermittency…) combined with other info (shear, meteo…)
Considerations • 2-eqs TCMs are now integral part of ocean models (POM, • ROMS, NCOM, ICOM?), but experience gained over past 2 decades indicates that these models can be made more skillful. • OF COURSE, influence of W-B, radiation stress, horiz. resolution, proper initialization to be investigated!!! We need to have a correct vertical structure, first. • 5. However, outstanding issues are: • a) Better performance under free convection • b) Inclusion of surface wave effects on mixing in the OML
Considerations • Surface Wave Effects have not been included properly in OML models until recently. Two kinds of effects: • a) TKE injection at the surface into the water column by wave breaking – has a surface effect (Umlauf, JSR 2003; Kantha, OM 2004). ROMS is following one approach (Warner GLS), but… • b) Stokes production of TKE by the interaction of waves • and turb. in the OML, can enhance turb. in the interior • 7. Langmuir cells (wind driven shear+Srokes drift) can also produce strong vertical velocities in the OML • 8. simple non-local models (counter-gradient term) need to be constructed for free convection situations. • 9. Can we possibly think of “assimilating” these typology of measurements?
TKE prod. by LC where and Adding additional production terms…
Surface TKE fluxes Two formulations to account for surface injection of TKE due to breaking waves. For GLS each formulation requires boundary conditions for k and . ~ 100; = surface stress #define craig_banner #define tke_wavediss a ~ 0.25 = wave energy dissipation …how get Zos ? #define charnok #define zo_hsig a = 1400 a = 0.5; Hs = significant wave height
Conclusions • Modern turbulence profilers enable routinely TKE dissipation measurements in marine environment • Dissipation measurements and data processing have to be carried out carefully to avoid falsification resulting from pseudo shear • Dissipation measurements in coastal waters require special attention due to sensor bottom hits, high particle conc. (falsified shears), strong shear layers and pycnoclines (change of profiler sinking leads to falsified dissipation rates) • Need of longer „time-series“, i.e. repeated measurements in the same spot (intermittency…) combined with other info (shear, meteo…)
Theoretical Dissipation rates In the convective layer: In the wind-stress driven ML: Within ML A length scale for the description of turbulent flows under stable stratification, defined as… In flows where turbulence and wave motion are simultaneously present, the inverse of the Ozmidov scale defines the buoyancy wavenumber, which separates the buoyancy subrange from the inertial subrange. Assuming LT proportional to Ozmidov scale Below ML =c+ s ,z D =i ,z >D For turbulence generated by momentum flux + destabilizing buoyancy flux:
Friction & Convective Velocity scale U*=(/)1/2 Wstar=(Jb0D)1/3 MO=U*3/(Jb0) R=(Wstar/U*)3
OP-6 (6 casts, 14.45-15.13 UTC) • Stronger wind • (7 m/s) • Insolation decreased • to 300 W/m2 • Ustar=0.95 cm/s • D=18m, MO=21m, • LT=3 m • (strong mixing above pycnocline)
Shear probe data processing From the lift force at the airfoil caused by potential flow (Allen and Perkins, 1952): F = 1/2 U2A sin2( 15) Definition of S (F E) E = U2 S sin2 rms. measurement for S E = 2 U2 Srms sin2 sin 2 = 2sin cosE = 22 VuSrms Differentiation, gain du/dt = (22 VGSrms)-1 dE/dt du/dt = V du/dz du/dz = (22 V2GSrms)-1 dE/dt …from the voltage output of the probe we then obtain an estimate of the TKE diss. rate TKE dissipation rate definition: = ui/xj (ui/xj + uj/xi) … and assuming isotropic turbulence:= 7.5 (du/dz)2
Where to improve/What to include • Wave breaking effects were ignored on Epsilon scaling (upper 2-3 m are not covered by measurements) • 2. Langmuir circulation, Stokes production • 3. Wave observation (Wave rider, buoy) • 4. Measurements of turbulent fluxes at sea VS bulk fluxes • 5. Measurements of shear (ADCP) and of the broad context around OP