Download
1 / 34
340 likes | 511 Vues
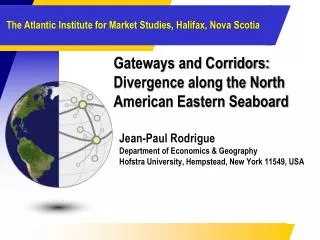
Gateways and Corridors: Divergence along the North American Eastern Seaboard. Jean-Paul Rodrigue Department of Economics & Geography Hofstra University, Hempstead, New York 11549, USA. Introduction. The Eastern Seaboard is going through a phase of divergence… … which does not benefit Halifax.

E N D
Gateways and Corridors: Divergence along the North American Eastern Seaboard Jean-Paul Rodrigue Department of Economics & Geography Hofstra University, Hempstead, New York 11549, USA
Introduction The Eastern Seaboard is going through a phase of divergence… … which does not benefit Halifax Trimodal Container Terminal, Willebroek, Belgium
A. Globalization, Trade and Port Divergence in North America • Factors of Port Divergence • What are the main processes behind divergence? • Containerized Traffic Trends • How containerization has evolved along the East Coast in recent years? • Traffic Concentration • What is the extent of the divergence taking place?
2. A Schematic Representation of the Eastern Seaboard St. Lawrence “The Funnel” Direct to the bottleneck: Montreal Upper Range “The Empty Sink” Weak handles: Halifax and Boston Mid Range “The Full Sink” Strong handles: New York and Hampton Roads Lower Range “The Filling Sink” Strong center: Charleston / Savannah Upper Range Lower Range Mid Range St. Lawrence
2. Container Traffic at Eastern Seaboard Ports, 2007 4th Tier (Niche ports) 3rd Tier (Regional Gateways) Divergence Threshold 2nd Tier (Gateways) Articulation Gateway
3. Concentration of Containerized Traffic, 1985-2007 Diffusion of Containerization Hinterland Effect
B. Cargo Volume Growth and Shipping Services • Traffic trend among major East Coast Ports • From convergence to divergence? • The resurgence of All Water Services • What are the underlying factors? • Service routes and transit times • How Landbridge and All Water Services compare?
1. Change in Container Traffic at Eastern Seaboard Ports 0.77 M TEU 8.36 M TEU 7.19 M TEU 1.31 M TEU +0.04 M TEU +2.01 M TEU +3.02 M TEU +0.28 M TEU
1. Strong Divergence: Montreal and Halifax Convergence Divergence Zero-sum game?
1. From Convergence to Divergence: the American East Coast (Annual Growth Rates) Divergence Convergence Divergence
2. The Resurgence of All Water Services to the East Coast Singapore Colombo Hong Kong “China Effect” Shanghai Jeddah Pusan Kobe Eastbound Route Gioia Tauro Algeciras Seattle / Vancouver Westbound Route LA/LB West Coast Congestion Landbridge Congestion Growth in the Southeast New Distribution Gateways Landbridge PanamaRoute
3. Service Routes and Transit Times: Far East to New York -1 +4 +7 +7 +12 +7
3. Service Routes and Transit Times: Far East to Norfolk, Virginia -1 +4 +7 +8 +12 +9
3. Service Routes and Transit Times: Far East to Savannah, Georgia -3 +3 +3 +4 +8 +11
3. The Resurgence of All Water Services to the East Coast Zone of Contestability NY Savannah Equilibrium (indifference) Point Eastbound Route New Direct Links 17 (2002) 26 (2007) New York (1): 75% (2005) 60% (2020) Westbound Route 3 New York (2+3): 25% (2005) 40% (2020) 1 Landbridge 2 PanamaRoute
3. Service Time Reliability to the EC: All Water Services vs. Transpacific / Landbridge Port congestion Offshore transshipment Transloading Unit train assembly Rail congestion Transmodal operations Road congestion Transpacific / Landbridge 18 days Port congestion Offshore transshipment Panama / Suez Delays All Water Services NY: 22 days Savannah: 21 days
Beware of Future Expectations: The Fallacies of Linear Thinking; Smoking Crack
Beware of Future Expectations: The Fallacies of Linear Thinking (Projected TEU Traffic, Port of NY/NJ)
3. Monthly Inbound Traffic (loaded containers), Port of Los Angeles (TEUs)
C. Port Regionalization and Potential Port Hinterland Divergence • The reemergence of the “hinterland factor” • How the maritime / land interface is being modified? • Port regionalization strategies • How specific gateway ports are improving their regional hinterland access?
1. The Reemergence of the “Hinterland Factor”: Rail Gateways and Metropolitan Freight Centers • New York • 85% are local cargo • 14% is distributed by rail • Less than 1% is distributed by water • Hampton Roads • Over 47% of cargo originates or is destined for locations within Virginia • 53% of cargo are hinterland bound
2. The Terminalization of Supply Chains • Terminalization • Growing influence of transport terminals in the setting and operation of supply chains in terms of location, capacity and reliability.
2. Terminalization in a Supply Chain Context Foreland Hinterland Inland Terminal Offshore Hub Gateway Gateway Suppliers DC DC Customers Bottleneck Extended Gate Buffer Extended Distribution Center Distribution center DC Port regionalization and the creation of a Regional Load Center Network Inland containerized goods flow Inland non-containerized goods flow Maritime container flow
2. Inland Terminals and Terminalization of Supply Chains High Gateway Port Inland corridor Degree of Gateways Synchronization Satellite Terminal Inland Terminal On call delivery Low DC Extended Distribution Center Low dwell time High dwell time
D. Conclusion: Challenges and Opportunities of the New Panama Canal (New Panamax – 12,000 TEU) Singapore Colombo Hong Kong Shanghai Jeddah Pusan Kobe Suez Gioia Tauro Algeciras Eastbound Route Westbound Route LA/LB Kingston Panama
Potential Impacts of High Oil Prices on Transportation: How Halifax Fits into the Picture? Usage level Modal shift P Q A/B P Q(A/B) Price Price Service area changes Gateway / Hub selection B R(B) A Cost A B 1 2 Range Network configuration Supply chain propagation Rail Road Distribution Centers Retailers Raw Materials Manufacturing
D. Conclusion: From Divergence to Convergence? • There is a divergence favoring a specific number of ports • Site: Limited number able to accommodate larger ships. • Ocean carriers: Emergence of all water services as a new dimension of standard port calls. • Port operators: Allocation of capital investment. • Policy: Ongoing privatization, albeit at a slower pace. • Hinterland: Development of rail corridors, particularly towards the Chicago hub. • Supply chain management: A stronger factor than accounted.