Download
1 / 28
280 likes | 369 Vues
Explore the evidence of finite sQGP formation time at RHIC through experimental observables, theoretical proofs, and conclusions derived from high-energy nuclear collision data.

E N D
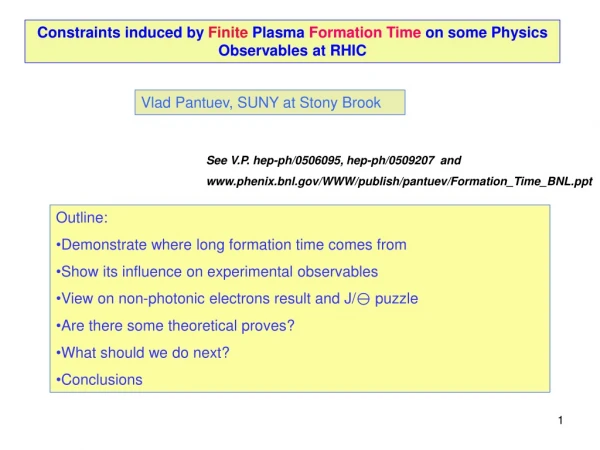
Evidence of finite sQGP formation time at RHIC Vlad Pantuev, Stony Brook University
Outline: • Demonstrate where long formation time comes from • Show its influence on experimental observables • View on non-photonic electrons result andJ/y puzzle • Are there some theoretical proofs? • Conclusions See V.P. hep-ph/0506095, hep-ph/0509207 And http://www.phenix.bnl.gov/WWW/publish/pantuev/WWNuclearDynamics2006.ppt
“pQCD-based calculations … reproduce much of the published data on high pT hadron production in nuclear collisions.Nevertheless, it is important to ask to what extent the data require this description to be the correct one.”P.Jacobs and M. van Leeuwen, QM2005 proceedings, nucl-ex/0511013 Let’s look just at experimental data and “see what we get…”
The Story, which is known for 5 years…Nuclear modification factor RAA = YieldAA / <N binary > : Yieldpp 0-10% 10-20% p0 RAA for 200 GeV Au Au Collisions 30-40% 20-30% PHENIX Preliminary 40-50% Min. bias RAA appears small and flat all the way to pT~20 GeV/c
Where formation time comes from? New quality data: Raa for 5-6 GeV/c pions vs.finreaction plane, PHENIX QM2005, preliminary X stopped OK Ncoll for 50-55% cent in x-y plane. WS, Glauber This is a key point.No absorption!?
We construct a simple geometrical model: • Monte Carlo simulation of A+A based of Glauber approach. Woods-Saxon density distribution • Restrict to high pt >4 GeV/c pions, where Raa does not depend on pt • Assume, all pions are produced by parton/jet fragmentation • Number of partons/jets is proportional to Ncoll • Ignore longitudinal expansion (actually, I do not construct microscopic model) • Jets, moving atsomedirectionand produced not deeper than distanceLwill leave unmodified • Jets, produced in the core region deeper thanLwill be absorbed completely • This is pure corona jet production, but we have to find corona thicknessL from experiment. L could be larger than a Woods-Saxon type skin • L should be on the order of the size of in-plane interaction zone at 50-55% centrality, about 2-3 fm
Raa(f) is inclusivemeasurement and in a particular event youalwayslook at some angle. Measure from here: out-plane, f=p/2 Measure from here: in-plane, f=0 L CutoffL=2.3 fmis adjusted forin-plane50-55% centrality Raa=0.9
Can calculate Raa as a ratio of seen number of collisions after the cut, Ncoll, to the average total number of binary collisions, <Nbinary > , for particular centrality class Black boxes -Results of my estimation with L=2.3 fm to get Raa=0.9 at 50-55% centrality
Averaged over all angles Raa: p0 , points with error bars – experimental data. Systematic errors are not shown This actually was prediction! Before QM2005, with the same L=2.3 fm
Can calculate elipticity parameter v2 as jet surviving probability inandoutof plane Data are for high pt pi0s, PHENIX, blue cicles – 4.59 GeV/c, green squares – 5-7 GeV/c, preliminary No hydro/collective flow!
Additional tests: • Smooth cut edge, up to 2 fm -> Very little change. • Consider the thickness of material integrated over the path as a cut-off -> centrality dependence becomes very strong, can’t describe the data • Assume, Npart , not Ncoll, is a critical value -> centrality dependence becomes weaker, v2 < 5% • Use nucleus in the hard sphere model -> v2 becomes large, about 20%
What could be a physical interpretation of geometrical cutoff L=2.3 fm ? Our guess is that it is, actually,formation time of strongly interacting plasma, T=L/c = 2.3 fm/c, or, at least, the time when strong parton energy loss starts. We don’t want to exclude QGP formation at early stages, but in takes time to becomesQGP - strongly interacting quark-gluon plasma . For Au+Au at 62.4 GeV data we get T=3.5 fm/c Very elegant explanation: Jets, particles have time, about 2-3 fm/c, to escape from interaction region. After that time a strongly interacting dense matter is formed and this matter absorbs jets.
If it istime, let’s make one more test: calculatefree streaming fast jetsin Au+Au at mid-rapidity with time
All jets after time 2.3 fm/c should be completely absorbed within W-S radii envelope
Green line is for Raa extracted with free expansion method. Free streaming is automatically taken into account in original assumptions
List of other features and constraints induced by finite plasma formation time on some physical observables at RHIC: • Formed matter, sQGP, is very opaque, “black body” • Raa for high pt particles is determined purely by such a “corona” production, not by parton partial energy loss, or in other words, • All pions (all light hadrons) above 5 GeV/c are produced from corona • Automatically explains flatness of Raa at high momenta • T=2.3 fm/c was adjusted for Raa in-plane for 50-55% centrality, but describes all Raa for Au+Au and Cu+Cu • So-called, PHOBOS Npart scaling is completely described. It is accidental. • No (very weak?) dependence of properties of near-side jets on centrality. All jets are produced from corona region • There is no flow contribution to v2 at high pt, it is purely geometry effect, v2 can reach 11-12%. • Explains behavior of v2 at intermediate pt region: There are two sources of produced particles, early corona and bulk matter itself. Hydro works well! Details follow.
How to explain rising and falling down v_2 with momentum? Relative contribution 100% core+hydro+exponent corona 0% pt At low momentum hydro scenario produces most of particles and v2 increases with momentum. At high pt, particles are produced from corona with smaller v2. Corona contribution “dilutes” hydro v2 at mid pt to the value of geometry limit
Jets, Raa Di-jets, Iaa
I_aa for A+A is ratio of: Yield of associate particles per trigger To Similar Yield in p + p Curve – corona production
Continue list of consequences: 10. All di-jets at high pt are from corona region 11. This is why no change of Back jet properties 12. There is no “punch-through” or re-appearance of di-jetsat high pt. At lower momentum, back jet is hard to find on Mach cone “background” 13. Absorption in the core is very strong – it stops 8-10 GeV parton! We may expect strong c-quark suppression as well 14. So, c-quarkcorona production must lead to anisotropy or v2, similar to light hadrons at high pt 15. J/y absorption has two stages. Should have v2 as well
PHENIX QM2005 preliminary result, statistical errors only T= 2.3 fm/c The effect sits really on geometrical limit. It means not “just” absorption but very strong absorption/energy loss. Measured v2 is close to corona expectation. Most of models are in trouble
Do we need charm to flow? May be not so much…? Theory:Greco, Ko, Rapp: PLB 595 (2004) 202
Do we have theoretical justification? From M. Thoma QM2005 talk, hep-ph/0509154: Plasma coupling parameter G=Epot/Tkin , G << 1 for gas, G >> 1 crystal. At RHIC G = 1.5 – 6, more like liquid. There should be Relaxation time. So, Needs Time to re-order to form long range correlations.Vapor needs time to make droplets and liquid. Empirically, we see very strong absorption, some theories prove it: S.-J. Sin & I. Zahed, Phys.Lett. B608(2005)265: use AdS/CFT duality to overcome problem of strong coupling. “… the quark-gluon liquid is very opaque. High energy jets at RHIC would not make it beyond 1/3 fm” E. Shuryak goes even beyond “liquid” sQGP, introducing polymer chains. Jet energy loss is small “until the matter cools down”which needs some latent time. J. Lia & E. Shuryak,hep-ph/0508035
For conclusions: • Experimental data lead toinevitable conclusion to the existence of a 2-3 fm/c formation time of Strongly interacting QGP at 200 GeV • Parton absorption in sQGP is VERY strong • We don’t have yet a solid theoretical justification of such a long time • The existence of formation time is a direct sign that sQGP is actually formed at RHIC • Formation time gets longer at lower energy: 2.3 fm/c at 200 GeV, 3.5 fm/c at 62 GeV. • At even lower energy, formation time is so long that sQGP can’t be formed at all because of fast longitudinal expansion
Wild guess about beam energy dependence of T: If relativistic rise of NN total cross section is purely contribution from hard scattering (this is a guess) Estimate NN total cross section by formula provided by Regge theory: sqrt_s = 20 GeV 38.6 mb hard scattering contribution Ds = 0 ?? sqrt_s = 62.4 GeV 43.65 mb Ds = 5 mb sqrt_s = 200 GeV 51.55 mb Ds = 13 mb sqrt_s =5500 GeV 87.2 mb Ds = 48.6 mb If formation time T is proportional to the mean distance between HARD scatterings (kind of, to make a la Shuryaks bonds), it should be T ~ 1/sqrt( Ds ) If at 200 GeV we have T=2.3 fm/c, we should get T = 3.6 fm/c at 62 GeV T = 1.2 fm/c at 5500 GeV at CERN