Download
1 / 34
340 likes | 452 Vues
Andrew Shepherd School of Geosciences, Edinburgh. Climate change Satellite observations Ice Sheets and Sea level. Climate change. Climate Change. Slow climate change. Mt Kilimanjaro, 1993. Climate Change. Slow climate change. Mt Kilimanjaro, 2000.

E N D
Andrew Shepherd School of Geosciences, Edinburgh
Climate change Satellite observations Ice Sheets and Sea level
Climate Change • Slow climate change Mt Kilimanjaro, 1993
Climate Change • Slow climate change Mt Kilimanjaro, 2000
Sea level contribution of Antarctica & Greenland Climate Change • Abrupt climate change
Climate Change • Abrupt climate change Larsen Ice Shelf, 2002
Climate Change • Abrupt climate change Larsen embayment, 2005
Climate Change • Abrupt climate change Larsen sea bed, 2005 Domack et al., 2005
Climate Change • IPCC Assessment reports (1990, 1995, 2001) 0.6 C rise since 1900 Global warming IPCC, 2001
Climate Change • IPCC Assessment reports (1990, 1995, 2001) 15 cm rise since 1900 Global sea level rise IPCC, 2001
Measured sea level Thermal expansion Glaciers & ice caps Greenland Antarctica Climate Change 1961-2003 1993-2003
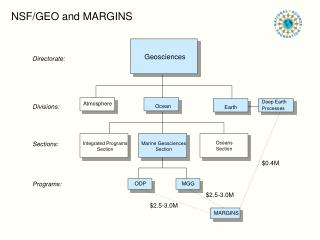
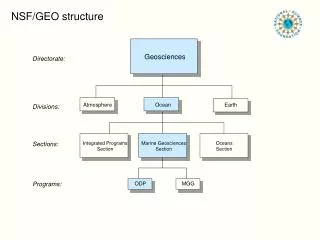
Monitoring Earths ice sheets from space Altimetry Interferometry Gravimetry
Satellite observations Altimetry
Mass change from volume change Satellite observations Altimetry
Satellite observations Interferometry
Satellite observations Interferometry
Mass change from glacier flow Satellite observations Interferometry
Satellite observations Gravimetry
Mass change from orbit change Satellite observations Gravimetry
1 km 1 km = 1 km 1 km3= 270 pints per person 7 km 7 km 7 km = 343 km3 ~ 1mm global sea level Sea level
Greenland 0.0 to 0.6 mm per year
Antarctica -0.1 to +0.4 mm per year
Summary • Satellite observations reveal sudden and recent changes in ice sheet flow • Climate models do not include these processes • Sea level projections are therefore of limited value
Summary UK today
Summary UK today No Polar Ice Sheets