Download
1 / 76
760 likes | 900 Vues
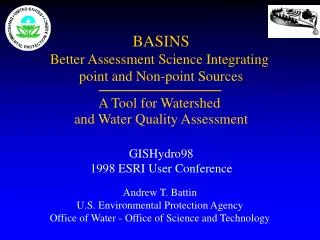
BASINS Better Assessment Science Integrating point and Non-point Sources A Tool for Watershed and Water Quality Assessment. GISHydro98 1998 ESRI User Conference. Andrew T. Battin U.S. Environmental Protection Agency Office of Water - Office of Science and Technology.

E N D
BASINS Better Assessment Science Integrating point and Non-point Sources A Tool for Watershed and Water Quality Assessment GISHydro98 1998 ESRI User Conference Andrew T. Battin U.S. Environmental Protection Agency Office of Water - Office of Science and Technology
Mission of EPA’s Office of Science and Technology • Mission Highlights • To provide technical assistance and support to the Agency’s Effluent Guidelines and to the Water Quality Criteria and Standards Program • To develop guidance on specific water quality issues • Develop methods, models, procedures to support nationwide watershed studies Problem Solving and Technical Tools
EPA Russell Kinerson Andrew Battin Jerry Laveck Marjorie Wellman Bill Tate Tetra Tech Inc. Mohammed Lahlou Leslie Shoemaker Sayedul Choudhury Andrew Parker Henry Manguerra Many Others Mimi Dannel Paul Cocca Hira Biswas Bryan Goodwin BASINS Development Team
Examples of Watershed Management Programs Supported by OST • Water quality assessment and analysis • Watershed management • Source water protection • TMDL program Varying problems - similar approaches
Commonalities ofWatershed Management Programs • Characterization:understand the “big picture”. What is contained with the watershed? What are the activities, uses, sources, and resources? • Source identification:what potential sources are within the watershed? Identify location and spatial distribution, potential magnitude of loading/stress, location/type of impacted resources. 1 2
Commonalities ofWatershed Management Programs • Develop and evaluate management alternatives:taking action requires an evaluation of the alternatives, consideration of the benefit/cost. Analysis considers what, where and how to control/manage pollutants/stressors. • Communicate watershed information to the public:present, describe, teach, and summarize environmental information and actions for the public stakeholders. 3 4
The Clean Water Act and TMDLs • Goal of CWA • Ensure that the Nation’s waters protect aquatic life, wildlife and human health • Tools • TMDLs are one of many tools authorized by the CWA to implement applicable water quality standards • Primary CWA Tool • NPDES permits for point sources - Nonpoint sources are not subject to NPDES permits • NPDES Permits • Contain effluent limits on pollution discharged, including water quality-based effluent limits when necessary to achieve water quality standards
303(d) List of Waters • Each state shall assemble and evaluate all existing and readily available water quality data and information to develop the Section 303(d) list of waters. • Each state shall identify those water quality-limited segments requiring TMDLs. • Water quality-limited segment: • Any segment where it is known that water quality does not meet applicable WQS, even after the application of effluent limits by the CWA.
303 (d) Summary of Key Points • List includes only those waters where technology-based limitations or other required actions are not expected to implement WQS. • List is based on existing and readily available data. • List is dynamic and changes over time to reflect new information, current practices, and new control activities. • Prioritization is not necessarily by waterbody, but can be prioritized by class (e.g., type of pollutant).
The TMDL Program TMDL = WLAi + LAi + MOS WLAi: Sum of waste loads (point sources) LAi: Sum of loads (non point sources) MOS: Margin Of Safety
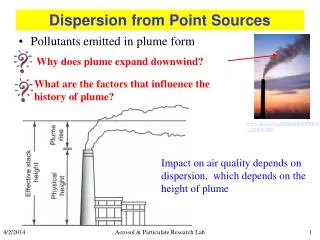
Problem Statement #1Point Source Criteria/standard (Allowable Capacity) C mg/l Cb Impaired reach Miles P1
Criteria/standard C mg/l Existing condition Allocation Scenario Time Problem Statement #2 Non-point Source
The Need for Technical Support • What do we have to show for the last 20 years? • A significant improvement in water quality • But there is still much more to do • Results • Lawsuits in >50% of states (more to come) • Some states have to do over 100 TMDLs per year • Many states are struggling to address complex issues • Georgia example • 4 TMDLs in first 20 years • About to complete 100 of 500 court ordered TMDLs
Overall Technical Support Philosophy • Move from guidance documents to more practical problem solving tools • Build local skills to keep long-term costs down • Make processes cost effective and affordable • Idaho has 900 TMDLs • Alternatives must be implementable • Ensure states have the best scientific approaches at their disposal • Peer review • Legal defensibility
Lessons from Recent Experience • Data • Accuracy, Age, Completeness are BIG issues • We can’t avoid making decisions • We have enough data to do something • New technology can make assessments easier, not easy • Requires dedication to increase skills • TMDL does not stop at the allocation • Need to be implemented • TMDLs are “life documents” • Phased schedules allow for improvements
The TMDL Program • Five key steps for TMDL development • Problem statement • Definition of endpoint • Source identification • Linkage between source and receiving water • AllocationAnalytical tools can be used to support each step of the TMDL “process”
Step 1: Problem statement: Inventory of watershed condition, systems, and spatial distribution of sources, as they relate to the water quality impairment. Develop a preliminary description of the problem and key interactions Set out a road map for the various components of the TMDL and the analytical needs TMDLs
Step 2: Definition of endpoint Evaluate local standards and reasons for listing the waterbody Review monitoring information In cases without numeric criteria, develop quantitative endpoint from indicators correlated to the impairment Step 3: Source identification Group sources by category (also used for allocation later) Evaluate source contribution to problem as load or other measure May need to consider hourly, daily, monthly or seasonal variability May consider loading of multiple interrelated constituents (i.e., Sediment and Nutrients) TMDLs
Step 4: Linkage between source and receiving water Evaluate receiving water response to source loadings Analyze assimilative capacity (how much loading can be adsorbed without violation of water quality standards) Examine receiving water response to loadings under current levels Consider the range of conditions Examination of spatial and temporal distribution of problems Determine the “critical condition” - those conditions under which problems occur TMDLs
Step 5: Allocation:distribution of loads among the various source categories Each distribution can be “unique” depending on type of pollutant, location of sources, and site specific characteristics of receiving waterbody More than one distribution may satisfy water quality standards. Selection of the preferred allocation depends on: Stakeholder preferences Implementation feasibility Cost Margin of safety (MOS) Part of the load is allocated to MOS to account for limitations in the accuracy of model/analytical procedures or underlying data. TMDLs
Analytical Needs to Support Water Quality Management Programs • Monitoring data • Represents condition of system • Provides the backbone for most analysis and modeling • Spatial/locational data • Point sources, highly erodible areas, construction areas... • Statistical analysis and mapping tools • Water quality trends, waterbody comparisons, proximity of impaired water quality to potential sources • Assessment and modeling tools • What are the relative contributions of the various pollution sources? • What will happen if we develop the watershed? • How can we evaluate planning and managementalternatives?
Analytical Needs (cont.) • Spatial analysis capabilities • Ability to relate causes and effects through mapping/overlays • Compilation, management, and facilitated access to historical data • Trend in land use changes, point source loadings, monitoring • Population growth - how much? Where? ... • Source characterization and quantification • Inventory of sources • Magnitude and significance of sources • Prediction of future conditions and implications of management • What is the best solution to meet objectives and regulatory requirements?
Watershed Small Area Studies Land Use Units Subwatersheds Rivers/Streams Sub 1 Urb Sub 2 Urban landuse with BMPs Sub 3 Ag Sub 4 Receiving Water Rural landuses with BMPs Sub 5
Watershed Dynamics • Multiple sources and stressors • Point and nonpoint sources • Sources are changing over time and space • Stressor-response relationships are difficult to establish • Multiple type of impacts • Simple (i.e. - bacteria, nutrients) • Complex (i.e. - habitat, stream stability)
Drivers for Watershed Management Tools • Anticipated TMDL workload • Lacked ability to integrate and analyze point and nonpoint sources • Key weaknesses for inability to develop TMDLs • Lacked understanding of nonpoint source processes • Sources are difficult to characterize • Difficulty in linking nonpoint sources to water quality response
Needs for Developing Innovative Tools • Differing scale watersheds • Need for site specific implementation plans • Defensible models • National data • Time and cost effectiveness
Overall Approach • GIS as host platform • All data • Address multiple scale watersheds • Link models to data in GIS • Use selected peer reviewed models • Provide continuous improvement, support, and training (building block approach)
BASINS V2.0 System Overview Target Assess DM Nationally Available Data Base Cartographic Data Environmental Background Data Environmental Monitoring Data Point Source/Loadings Data Assessment Tools Target Assess Data Mining Watershed Reporting • Models • HSPF - NPSM • QUAL2E • TOXIROUTE • Model Post-Processors Decision-Making Analysis Watershed Management . TMDLs . Source Water Protection . Stormwater State and Local Data
GIS DataData Categories • Base Cartographic Data • Environmental Data
Base Cartographic Data • Definition: • Data that enhances the ability to interpret maps by providing a known frame of reference • Examples: • EPA regional boundaries • Major roads • Populated place locations • State and county boundaries • Urbanized area boundaries
BASINS Environmental Data • Data capturing information on spatial and temporal changes in environmental conditions GIS Physical Data (Landscape Features) Monitoring Data (Environmental Response) Pollution Sources (Environmental Stressors)
BASINS Data ProductsEnvironmental Data • Pollution sources • Permitted dischargers (PCS) • Toxic Release Inventory sites (TRI) • Industrial Facility Dischargers (IFD) • Mineral Industry Locations • Superfund sites (NPL) • Land Use/ Land Cover • Population centers GIS Landscape Sources Monitoring
BASINS Data ProductsEnvironmental Data • Physical landscape features • USGS Watershed boundaries • RF1 and RF3 Stream networks • Land Use/ Land Cover • Elevation (DEM) • Dam locations • Soil characteristics GIS Landscape Sources Monitoring
BASINS Data ProductsEnvironmental Data • Environmental monitoring • Water Quality station summaries (STORET) • Bacteria station summaries (STORET) • Water Quality Observation Data • National Sediment Inventory (NSI) • USGS Stream flow (gaging stations) • Fish and Wildlife Advisories • Shellfish Contamination Inventory • Clean Water Needs Survey • Meteorological (477 station locations) GIS Landscape Sources Monitoring
Example of GIS Coverage of Meteorological Station WDM INF Identify appropriate Meteorological Station from GIS NPSM Meteorological Station Selection Screen Meteorological Data in BASINS
Types of Tools Included in BASINS(3 Categories of Tools) • Spatial analysis and overlays (GIS capability) • Facilitate examination of multiple types of information • Access to full functionality of ArcView • BASINS custom suite of integrated tools • Targeting • Assessment • Data Mining • Watershed Reporting • BASINS utilities • Import new or local data sets (watersheds, landuse) • Re-classify landuse, DEM • Watershed Delineation
Target Assess DM Custom Tools included withBASINS • Target:Provides broad-based evaluation of watershed water quality and point source loadings. • Assess:Watershed-based evaluation of specific water quality stations and/or dischargers and their proximity to waterbodies. • Data Mining:Dynamic link of data elements using a combination of tables and maps. Allows for visual interpretation of geographic and historical data. • Watershed Reporting:Automated summary report system. Allows users to select types of information to be included. Automated generation of associated graphics and tables. Regional Level Watershed Level Station Level
Target Assess DM BASINSCustom ToolTarget • Objective • Broad based evaluation of watershed conditions • Process site specific water quality or permitted discharges data and provide “basin-scale” summaries • Rank watersheds based on user defined evaluation parameters and thresholds • Output • Map of watersheds shaded according to monitoring summary value • Bar chart of distribution of watersheds • Bar chart of average monitoring values by watershed
Target Overall summary of monitoring data Select Target option from menu Ranking of watershed Distribution of monitoring data by CU
Target Assess DM BASINSCustom ToolAssess • Objective • Evaluation of watershed conditions forselected watershed(s) • Adds consideration of spatial distribution of potential pollution problems • Evaluate status and trends over time (statistical summaries by time period) • Consider data availability and data gaps • Output • Map of water quality stations ranked according to concentration of selected pollutants • Bar chart of distribution of monitoring stations • Location map of selected watersheds
Assess Distribution of monitoring stations by CU Select Assess option from menu Average condition for selected pollutant by CU Station summaries for selected pollutant
Target Assess DM BASINSCustom Tool Data Mining • Objective • Facilitated analysis of relational information at the station level • Evaluate available data and identify gaps • Compare stations and monitoring periods • Output • Map of watershed area selected with active stations highlighted • List of selected stations and monitoring summaries all dynamically linked to each other and the map
Data Mining Spatial distribution of monitoring stations WQ stations WQ parameter and code WQ summaries
BASINSCustom ToolWatershed Report Information available: • Administrative and locational report • Point source discharge summary • Dam locations • State soil series data • Land use summary • Stream system inventory • Toxics (NSI, TRI) • STORET water quality monitoring
BASINSUtility ToolImport • The import tool gives users the capability to add their own data into the BASINS system: • Watershed boundaries (8-digit or smaller) • Landuse • Reach File 3 • Elevation (DEM) Polygons • Water Quality Observation Data