

Abstract
E N D
Presentation Transcript
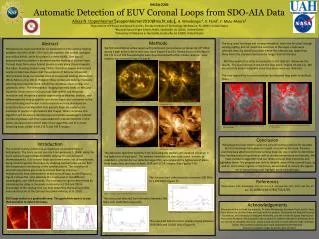
SH13A-2240Automatic Detection of EUV Coronal Loops from SDO-AIA DataAlissa N. Oppenheimer¹(aoppenheimer2010@my.fit.edu), A. Winebarger², S. Farid³, F. Mulu-Moore²¹Department of Physics and Space Sciences, Florida Institute of Technology, Melbourne, FL 32907, United States²Marshall Space Flight Center, NASA, Huntsville, AL 35811, United States³University of Alabama in Huntsville, Huntsville, AL 52899, United States Methods We first identified an active region with prominent coronal loops on November 8th 2011, during a high point in the recent solar cycle (Figure 3 and 5). Twelve hours of AIA data in the 171 Å and 193 Å wavelengths were downloaded with a five minute cadence. Solar rotation was removed (Figure 4 and 6). The detection algorithm works by first calculating the median and standard deviation in the lightcurve of each pixel. The median intensities are then subtracted. In order to establish a criterion for our detection algorithm, we compared the lightcurves of pixels from loops, fans, and moss in both 193Å and 171 Å images. (See Figures 7-9) The loop pixel had large and varying intensities, while the fan pixel, though varying slightly, did not match the extremes of the loops. Loops were selected, then, by identifying pixels where the intensity was larger than three times the standard deviation for longer than 50 minutes. We then applied the detection program to the data set. Below are the results. The pixels shown in red are the loop pixels. (Figure 10 and 11). We are currently determining why some loop pixels were not detected. The next step will be to cross-correlate the detected loop pixels in multiple filters. Abstract Heliophysicists have searched for an explanation to the coronal heating problem since the 1930’s. The Sun’s atmosphere, the corona, averages one million Kelvin, while its surface is a mere 6000K. One way of approaching this problem is by examining the heating of coronal loops. Coronal loops form when heated plasma travels along closed magnetic flux tubes. Previous studies using TRACE (Transition Region and Coronal Explorer) data have shown that the evolution of Extreme Ultraviolet (EUV) coronal loops can provide clues to the coronal heating mechanism (Mulu-Moore, et al. 2011). However these studies are done by manually selecting loop pixels by hand, which may introduce observer bias and systematic error. The Atmospheric Imaging Assembly (AIA) on the Solar Dynamics Observatory (SDO) provides high-spatial and temporal resolution and therefore a special opportunity to observe, analyze, and differentiate the loop properties and derive important constraints to the coronal heating mechanism. In this research we have developed an automatic detection algorithm that extracts loops by analyzing the evolution of pixels in high-cadence AIA images. When complete, this algorithm will be able to identify loops in multiple wavelengths without introducing biases and errors associated with manual methods. In this poster we discuss the current state of our algorithm and its success detecting loops visible in AIA 171 Å and 193 Å images. Moss Loop Fan Figure 3. SDO/AIA 171 Image from November 8th, 2011 Figure 4. Zoomed in and de-rotated image of the active region on November 8th, 2011 Loop Fan Figure 11. Detect images of highlighted pixels defining coronal loops in 193 wavelength Figure 10. Detect images of highlighted pixels defining coronal loops in 171 wavelength. Conclusion Heliophysicists have tried to solve the coronal heating problem for decades. EUV coronal loops have given an insight to resolving the issue. Previous scientists have attempted to trace coronal loops by eye in order to determine their heating and cooling times as well as plasma temperature and density. We have created an algorithm that can detect coronal loop intensities and highlights them. The program was able to identify most of the coronal loops, as well as some other regions. In the future, we will work to reduce the regions not in coronal loops and highlight more coronal loops. Introduction The coronal heating problem is an important unresolved issue in heliophysics. The Sun’s corona can reach temperatures 1-10MK, while the Sun’s surface is approximately 6,000K, defying the second law of thermodynamics. EUV coronal loops are formed when hot plasma travels along closed magnetic flux tubes. By studying coronal loops we can find the temperature and density of the coronal plasma. The evolution of coronal loop plasma give clues to coronal heating. Previous heliophysicists have attempted to detect coronal loops by eye (Figure 1). Figure 2 shows the total intensity of a single pixel in two different wavelengths, over 4000 seconds. The cooling time can be determined by calculating the delay in the peaks in intensity in 171Å and 193 Å. Knowledge of the cooling time can help determine the heating profile and sub-structure of the coronal loop (Mulu-Moore, et al. 2011). EUV loops evolve in a predictable way. The goal of this work is to use that evolution to detect the loops. Moss Figure 5. SDO/AIA 193 Image from November 8th, 2011 Figure 6. Zoomed in and de-rotated image of the active region on November 8th, 2011 The fan pixel had calm intensities between 200 DN/s to 1,500 DN/s (Figure 7). References Mulu-Moore, F.M., Winebarger, A.R., Warren, H.P., Aschwanden, M.J., 2011, ApJ 733, 59 doi: 10,1088/0004-673X/733/1/59 Figure 7. Fan light curves from three pixel points over a 12 hour period The moss pixel selected, had intensities between 500 DN/s and 2500 DN/s (Figure 8). Acknowledgements Alissa would like to thank her advisers, Dr. Amy Winebarger, Samaiyah Farid, and Dr. Fana Mulu-Moore for all there time and help with this project. She thanks the National Science Foundation, the University of Alabama Huntsville, and the Center for Space Plasma and Aeronomic Research. She would also like to thank Dr. Hakeem Oluseyi for allowing her to use the lab to complete this work. Alissa would also like to thank Dominic Robe and Katie Kosak. This material is based upon work supported by the National Science Foundation under Grant No. AGS-1157027. Figure 8. Moss light curves from three pixel points over a 12 hour period The loop pixel had intensities widely ranging between 1500 DN/s and 15,000 DN/s (Figure 9). Figure 2. Light curves in 171(Pink) & 195(Blue) wavelengths (Mulu-Moore, et al. 2011) Figure 1. Hand traced coronal loops (Mulu-Moore, et al. 2011) Figure 9. Loop light curves from a pixel points over a 12 hour period


