OMS 201 Review
230 likes | 397 Vues
OMS 201 Review. OMS 201 Review. Range. The range of a data set is the difference between the largest and smallest data values. It is the simplest measure of dispersion. It is very sensitive to the smallest and largest data values. OMS 201 Review. Variance. The. variance.

OMS 201 Review
E N D
Presentation Transcript
OMS 201 Review Range • The range of a data set is the difference between the largest and smallest data values. • It is the simplest measure of dispersion. • It is very sensitive to the smallest and largest data values.
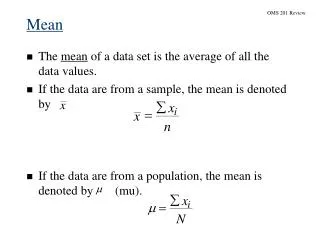
OMS 201 Review Variance The variance is the average of the squared n differences between each data value and the mean. If the data set is a sample, the variance is denoted n - 2 - å by . s 2 ( ) x x i i 2 = = s - - 1 n If the data set is a population, the variance is n s denoted by . 2 2 - m å ) ( x ) 2 s = N
OMS 201 Review Random Variables • A random variableis a numerical description of the outcome of an experiment. • A discrete random variablemay assume either a finite number of values or an infinite sequence of values. • A continuous random variablemay assume any numerical value in an interval or collection of intervals.
OMS 201 Review Expected Value and Variance • The expected value, or mean, of a random variable is a measure of its central location. • Expected value of a discrete random variable: E (x ) = = x f (x )
n ! - x ( n x ) = - f ( x ) p ( 1 p ) - x ! ( n x ) ! OMS 201 Review The Binomial Probability Distribution where f (x ) = the probability of x successes in n trials n = the number of trials p = the probability of success on any one trial
OMS 201 Review Example: Evans Electronics • Using the Tables of Binomial Probabilities
f (x ) x OMS 201 Review The Normal Probability Distribution • Graph of the Normal Probability Density Function
OMS 201 Review Sampling Distribution of for the SAT Scores From Census From Census
OMS 201 Review Using the standard normal probability table with z = 10/11.3 = .88, we have area = (.3106)(2) = .6212. There is a .6212 probability that the sample mean will be within +/-10 of the actual population mean. How do we increase this probability? When n is increased the standard error of the mean is decreased Large sample sizes will provide a higher probability that the sample mean is within a specified distance of the mean!
OMS 201 Review Interval Estimation of a Population Mean:Small-Sample Case (n < 30) • If Population is not normally distributed: • The only option is to increase the sample size to n> 30 and use the large-sample interval-estimation procedures. • If Population is normally distributed and is known: • The large-sample interval-estimation procedure can be used. • If Population is normally distributed and is unknown: • The appropriate interval estimate is based on a probability distribution known as the t distribution.
OMS 201 Review t Distribution • The t distribution is a family of similar probability distributions. • A specific t distribution depends on a parameter known as the degrees of freedom. • As the number of degrees of freedom increases, the difference between the t distribution and the standard normal probability distribution becomes smaller and smaller. • A t distribution with more degrees of freedom has less dispersion. • The mean of the t distribution is zero.
OMS 201 Review Interval Estimation of a Population Mean:Small-Sample Case (n < 30) with Unknown • The interval estimate is given by: where 1 - is the confidence coefficient t/2is the t value providing an area of /2 in the upper tail of a t distribution with n - 1 degrees of freedom s is the sample standard deviation
OMS 201 Review Interval Estimationof a Population Proportion • The interval estimate is given by: where 1 - is the confidence coefficient z/2 is the z value providing an area of /2 in the upper tail of the standard normal probability distribution is the sample proportion
OMS 201 Review Goodness of Fit Test Some forecasting procedures assume that the sample data fit a known distribution. Ho: The sample data fit the distribution Ha: The sample data do not fit the distribution Table value with 3 (4-1) degrees of freedom = 7.81473 Do Not Reject Ho: Calculate a chi-square statistic. Compare to chi-square table with k-1 degrees of freedom, where k = # of categories. If the calculated value is less than the table value, it is a good fit (Do not reject Ho:). If the calculated value is larger than the table value, a poor fit is indicated (Reject Ho:).