Download
1 / 44
440 likes | 664 Vues
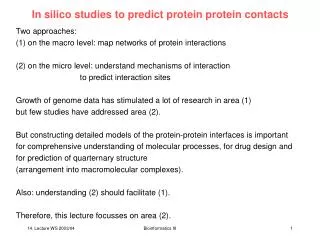
V4 In silico studies to predict protein protein contacts. Field of studying protein interactions is split into two areas: (1) on the macro level: map networks of protein interactions (2) on the micro level: understand mechanisms of interaction to predict interaction sites

E N D
V4 In silico studies to predict protein protein contacts Field of studying protein interactions is split into two areas: (1) on the macro level: map networks of protein interactions (2) on the micro level: understand mechanisms of interaction to predict interaction sites Growth of genome data stimulated a lot of research in area (1). Fewer studies have addressed area (2). Constructing detailed models of the protein-protein interfaces is important for comprehensive understanding of molecular processes, for drug design and for prediction the arrangement into macromolecular complexes. Also: understanding (2) should facilitate (1). Therefore, this lecture focusses on linking area (2) to area (1). Bioinformatics III
Bioinformatic identification of interface patches Statistical analysis of protein-protein interfaces in crystal structures of protein-protein complexes: residues at interfaces have significantly different amino acid composition that the rest of the protein. predict protein-protein interaction sites from local sequence information ? Conservation at protein-protein interfaces: interface regions are more conserved than other regions on the protein surface identify conserved regions on protein surface e.g. from solvent accessibility Patterns in multiple sequence alignments: Interacting residues on two binding partners often show correlated mutations (among different organisms) if being mutated identify correlated mutations Structural patterns: surface patterns of protein-protein interfaces: interface often formed by hydrophobic patch surrounded by ring of polar or charged residues. identify suitable patches on surface if 3D structure is known Bioinformatics III
1 Analysis of interfaces 1812 non-redundant protein complexes from PDB (less than 25% identity). Results don‘t change significantly if NMR structures, theoretical models, or structures at lower resolution (altogether 50%) are excluded. Most interesting are the results for transiently formed complexes. Ofran, Rost, J. Mol. Biol. 325, 377 (2003) Bioinformatics III
1 Amino acid composition of interface types The frequencies of all residues found in SWISS-PROT were used as background when the frequency of an amino acid is similar to its frequency in SWISS-PROT, the height of the bar is close to zero. Over-representation results in a positive bar, and under-representation results in a negative bar. Ofran, Rost, J. Mol. Biol. 325, 377 (2003) Bioinformatics III
1 Pairing frequencies at interfaces red square: interaction occurs more frequently than expected; blue square: it occurs less frequently than expected. (A) Intra-domain: hydrophobic core is clear (B) domain–domain, (C) obligatory homo-oligomers, (D) transient homo-oligomers, (E) obligatory hetero-oligomers, and (F) transient hetero-oligomers. The amino acid residues are ordered according to hydrophobicity, with isoleucine as the most hydrophobic and arginine as the least hydrophobic. propensities have been successfully used to score protein-protein docking runs. Ofran, Rost, J. Mol. Biol. 325, 377 (2003) Bioinformatics III
2 NOXClass: Distinguish Permanent / Transient Complexes Aim: (1) distinguish different types of biological interactions (X-ray structures of protein- protein complexes). (2) develop automatic classification scheme. Zhu, Domingues, Sommer, Lengauer, BMC Bioinformatics 7, 27 (2006), Bioinformatics III
Dataset Bioinformatics III
Interface properties considered Zhu, Domingues, Sommer, Lengauer, BMC Bioinformatics 7, 27 (2006), Bioinformatics III
Distribution of interface area Interface area = Crystal packing contacts have very small interfaces. Obligate interfaces are on average larger than non-obligate interfaces. Zhu, Domingues, Sommer, Lengauer, BMC Bioinformatics 7, 27 (2006), Bioinformatics III
Dataset The distributions of obligate and non-obligate interfaces are quite similar, but very different from crystal packing contacts. Zhu, Domingues, Sommer, Lengauer, BMC Bioinformatics 7, 27 (2006), Bioinformatics III
Hydrophobic residues (FLIV) contribute twice as much to obligate interfaces as to crystal packing contacts. Aromatic residues (FWY) tend to be more abundant in biological interfaces. Zhu, Domingues, Sommer, Lengauer, BMC Bioinformatics 7, 27 (2006), Bioinformatics III
Good Performance Zhu, Domingues, Sommer, Lengauer, BMC Bioinformatics 7, 27 (2006), Bioinformatics III
3 Multimeric threading: Fit pair A, B to complex database Phase 1: single-chain threading. Each sequence is independently threaded and assigned to a list of possible candidate structures according to the Z-scores of the alignments. The Z-score for the k-th structure having energy Ekis given by: where E and are the mean and standard deviation values of the energy of the probe in all templates of the structural database. For the assignment of energies, statistical potentials of residue pairing frequences are used. Library of 3405 protein folds where the pairwise sequence identity is < 35%. Lu, ..., Skolnick, Genome Res 13, 1146 (2003) Bioinformatics III
Multimeric threading Phase 2: a set of probe sequences, each at least weakly assigned to a monomer template structure that is part of a complex, is then threaded in the presence of each other in the associated quarternary structure. If the interfacial energy and Z-scores are sufficiently favorable, the sequences are assigned this quarternary structure. Lu, ..., Skolnick, Proteins 49, 350 (2002), Genome Res 13, 1146 (2003) Bioinformatics III
Database of Dimer Template Structures criteria: 1 The resolution of the two-chain PDB records should be < 2.5 Å. 2 The threshold for the number of interacting residues is set to be >30 to avoid crystallizing artifacts. Interacting residues are defined as a pair of residues from different chains that have at least one pair of heavy atoms within 4.5 Å of each other. 3 Each chain in the dimer database should have >30 amino acids to be considered as a domain. 4 Dimers in the database should not have >35% identity with each other. 5The dimers should be confirmed in the literature as genuine dimers instead of crystallization artifacts. This selection resulted in 768 dimer complexes (617 homodimers, 151 heterodimers) Lu, Skolnick, Proteins 49, 350 (2002), Bioinformatics III
Interfacial statistical potentials Interfacial pair potentials P(i,j) (i = 1...20, j = 1 ... 20) are calculated by examining each interface of the selected dimers in the database by: where Nobs(i,j) is the observed number of interacting pairs of i,j between two chains. Nexp(i,j) is the expected number of interacting pairs of i,j between two chains if there are no preferential interactions among them. Nexp(i,j) is computed as where Xiis the mole fraction of residue i among the total surface residues. Xtotal is the number of total interacting pairs. Lu, Skolnick, Proteins 49, 350 (2002), Bioinformatics III
Dimer Template Structures 2-stage protocol for MULTIPROSPECTOR: In phase I, both sequences X and Y are independently threaded by using PROSPECTOR. A set of templates A and B with initial Z-score > 2.0 is identified. Phase II begins with the decision of whether the template structure pair AiBj is part of a known complex. Only when AiBj forms a complex does multimeric threading continue to rethread on the partners in the complex and incorporate the protein-protein interfacial energies. Double-chain threading is used in this step. It first fixes the alignment of X to the template A and adjusts the alignment of Y to the template B, and then it fixes the alignment of Y to the template B and adjusts the alignment of X to the template A. Finally, the algorithm gives the template AiBj that has the highest Z-score as a possible solution. At the same time, the algorithm provides the total energy of the complex as well as the interfacial energy. Lu, Skolnick, Proteins 49, 350 (2002), Bioinformatics III
Genomic-scale prediction of protein-protein interactions Out of 6298 unique ORFs encoded by S. cerevisae, 1836 can be assigned to a protein fold by a medium-confidence Z-score. Result: 7321 predicted interactions between 1256 different proteins. (Use this set for analysis). Lu, ..., Skolnick, Genome Res 13, 1146 (2003) Bioinformatics III
Subcellular localization Distribution of subcellular localization of yeast proteome (obtained from the YPD datatase at MIPS, Munich) compared with proteins involved in our predicted interactions prediction is somehow biased towards the cytoplasmic compartment and against unknown locations. Lu, ..., Skolnick, Genome Res 13, 1146 (2003) Bioinformatics III
Co-localization of interaction partners Use localization data to assess the quality of prediction because two predicted interacting partners sharing the same subcellular location are more likely to form a true interaction. Comparison of colocalization index (defined as the ratio of the number of protein pairs in which both partners have the same subcellular localization to the number of protein pairs where both partners have any sub-cellular localization annotation). Multithreading predictions (MTA) are less reliable than high-confidence inter-actions, but score quite well amongst predictions + HTS screens. Lu, ..., Skolnick, Genome Res 13, 1146 (2003) Bioinformatics III
Which structural templates are used preferentially? Structural groups of predicted interactions: the number of predictions assigned to the protein complexes in our dimer database. The 100 most populous complexes are shown. The inset is an enlargement for the top 10 complexes. 1KOB – twitchin kinase fragment 1CDO – liver class I alcohol dehydrogenase 1IO9 – glycogen synthase kinase-3 beta 1QBK – nuclear transport complex 1AD5 – src family tyrosine kinase 1J7D – ubiquitin conjugating enzyme complex 1CKI – casein kinase I delta 1BLX – cyclin-dependent kinase CDK6/inhibitor 1HCI – rod domain alpha-actinin 1QOR – quinone oxidoreductase Lu, ..., Skolnick, Genome Res 13, 1146 (2003) Bioinformatics III
Do partners have the same function? Proteins from different groups of biological functions may interact with each other. However, the degree to which interacting proteins are annotated to the same functional category is a measure of quality for predicted interactions. Here, the predictions cluster fairly well along the diagonal. Lu, ..., Skolnick, Genome Res 13, 1146 (2003) Bioinformatics III
Cofunctionality index Cofunctionality index is defined as the ratio of the average protein interaction density for homofunctional interactions (diagonal of the matrix in A) to the average protein interaction density for heterofunctional interactions. MTA method ranks third. Lu, ..., Skolnick, Genome Res 13, 1146 (2003) Bioinformatics III
Correlation with mRNA abundance Correlation between predicted interactions and mRNA abundance. The yeast proteome is divided into ten groups of equal size according to their mRNA expression levels and is arranged in an increasing abundance order from 1–10. In contrast to other methods, MTA predictions are not correlated with abundance of mRNA expression. Method seems more capable of revealing interactions with low abundance. Lu, ..., Skolnick, Genome Res 13, 1146 (2003) Bioinformatics III
Overlap between Large-Scale Studies Unfortunately, the overlap of identified interactions by different methods is still very small. Lu, ..., Skolnick, Genome Res 13, 1146 (2003) Bioinformatics III
Summary • There exists now a small zoo of promising experimental and theoretical methods to analyze cellular interactome: which proteins interact with each other. • Problem 1: each method detects too few interactions (as seen by the fact that the overlap between predictions of various methods is very small) • Problem 2: each method has an intrinsic error rate producing „false positives“ and „false negatives“). • Ideally, everything will converge to a big picture eventually. Solving Problem 1 will help solving problem 2 by combining predictions. Problem 1 can be partially solved by producing more data :-) • By combining results from various exp. and prediction methods one can estimate the quality of the interactions by statistic methods Bioinformatics III
4 Correlated mutations at interface Pazos, Helmer-Citterich, Ausiello, Valencia J Mol Biol 271, 511 (1997): correlation information is sufficient for selecting the correct structural arrangement of known heterodimers and protein domains because the correlated pairs between the monomers tend to accumulate at the contact interface. Use same idea to identify interacting protein pairs. Bioinformatics III
Correlated mutations at interface Correlated mutations evaluate the similarity in variation patterns between positions in a multiple sequence alignment. Similarity of those variation patterns is thought to be related to compensatory mutations. Calculate for each positions i and jin the sequence a rank correlation coefficient (rij): where the summations run over every possible pair of proteins k and l in the multiple sequence alignment. Siklis the ranked similarity between residue i in protein k and residue i in protein l. Sjkl is the same for residue j. Si and Sj are the means of Sikland Sjkl. Pazos, Valencia, Proteins 47, 219 (2002) Bioinformatics III
i2h method Schematic representation of the i2h method. A: Family alignments are collected for two different proteins, 1 and 2, including corresponding sequences from different species (a, b, c, ). B: A virtual alignment is constructed, concatenating the sequences of the probable orthologous sequences of the two proteins. Correlated mutations are calculated. C: The distributions of the correlation values are recorded. We used 10 correlation levels. The corresponding distributions are represented for the pairs of residues internal to the two proteins (P11 and P22) and for the pairs composed of one residue from each of the two proteins (P12). Pazos, Valencia, Proteins 47, 219 (2002) Bioinformatics III
Predictions from correlated mutations Results obtained by i2h in a set of 14 two domain proteins of known structure = proteins with two interacting domains. Treat the 2 domains as different proteins. A: Interaction index for the 133 pairs with 11 or more sequences in common. The true positive hits are highlighted with filled squares. B: Representation of i2h results, reminiscent of those obtained in the experimental yeast two-hybrid system. The diameter of the black circles is proportional to the interaction index; true pairs are highlighted with gray squares. Empty spaces correspond to those cases in which the i2h system could not be applied, because they contained <11 sequences from different species in common for the two domains. In most cases, i2h scored the correct pair of protein domains above all other possible interactions. Pazos, Valencia, Proteins 47, 219 (2002) Bioinformatics III
Predicted interactions for E. coli Number of predicted interactions for E. coli. The bars represent the number of predicted interactions obtained from the 67,238 calculated pairs (having at least 11 homologous sequences of common species for the two proteins in each pair), depending on the interaction index cutoff established as a limit to consider interaction. Among the high scoring pairs are many cases of known interacting proteins. Pazos, Valencia, Proteins 47, 219 (2002) Bioinformatics III
5 Coevolutionary Analysis Idea: if co-evolution is relevant, a ligand-receptor pair should occupy related positions in phylogenetic trees. Goh & Cohen, 2002 showed that within correlated phylogenetic trees, the protein pairs that bind have a higher correlation between their phylogenetic distance matrices than other homologs drawn drom the ligand and receptor families that do not bind. Other Idea: analyze occurrence of proteins that can functionally substitute for another in various organisms. Detect analogous enzymes in thiamin biosynthesis Bioinformatics III
Detect analogous enzymes in thiamin biosynthesis Gene names are applied according to the first gene described from a group of orthologs. Solid black arrows represent known or proposed reaction steps and dashed black arrows indicate unknown reactions. In addition, significant anticorrelations in the occurrence of genes across species (red arrows), and relevant in silico predicted protein-protein interactions (blue dashed arrows) are illustrated. Distinct precursors have been proposed for different species3-5 (indicated in gray). Genes with orthologous sequences35 in eukaryotes and prokaryotes are in green; genes assumed to be prokaryote-specific are black. Interestingly, significant 'one-to-one' anticorrelations usually involve a prokaryote-specific and a 'ubiquitous' gene. Abbreviations: AIR, 5-aminoimidazole ribonucleotide; Cys, cysteine; Gly, glycine; His, histidine; HMP, 2-methyl-4-amino-5-hydroxymethylpyrimidine; THZ, 4-methyl-5- -hydroxyethylthiazole; Tyr, tyrosine; Vit. B6, Vitamin B6. Morett et al. Nature Biotech 21, 790 (2003) Bioinformatics III
THI-PP biosynthesis pathway: analogous genes Negatively correlating gene occurrences are highlighted using the same colors. Species having at least two genes with a role unique to THI-PP biosynthesis38 are predicted to possess the functional pathway. The column 'STRING score' shows the most significant interaction for each gene, predicted using the STRING server. Predicted interaction partners are listed in the column 'Interact. with'. COG id: „id in groups of orthologous proteins server“ (a) Essential THI-PP biosynthesis enzymes, which are unique to the pathway. (b) Essential THI-PP biosynthesis enzymes, which have been implicated in more than one biological process. The thiO gene, suggested to play a role in the pathway24, was also added to that list. (c) Proteins predicted in silico to be involved in the pathway. 4 analogies detected: thiE can be replaced by MTH861 thiL by THI80 thiG by THI4 thiC by tenA Morett et al. Nature Biotech 21, 790 (2003) Bioinformatics III
Interpretation Proteins that functionally substitute eachother have anti-correlated distribution pattern across organisms. allows discovery of non-obvious components of pathways and function prediction of uncharacterized proteins and prediction of novel interactions. Morett et al. Nature Biotech 21, 790 (2003) Bioinformatics III
6 Construct complete network of gene association Network reconstructions have largely focused on physical protein interaction and so represent only a subset of biologically important relations. Aim: construct a more accurate and extensive gene network by considering functional, rather than physical, associations, realizing that each experiment, whether genetic, biochemical, or computational, adds evidence linking pairs of genes, with associated error rates and degree of coverage. In this framework, gene-gene linkages are probabilistic summaries representing functional coupling between genes. Only some of the links represent direct protein-protein interactions; the rest are associations not mediated by physical contact, such as regulatory, genetic, or metabolic coupling, that, nonetheless, represent functional constraints satisfied by the cell during the course of the experiments. Working with probabilistic functional linkages allows many diverse classes of experiments to be integrated into a single coherent network which enables the linkages themselves to be more reliably Lee, ..., Marcotte, Science 306, 1555 (2004) Bioinformatics III
Method for integrating functional genomics data Benchmark functional genomics data sets for their relative accuracies. Several raw data sets already have intrinsic scoring schemes, indicated in parentheses (e.g., CC, correlation coefficients; P, probabilities, and MI, mutual information scores). These data are rescored with LLS, then integrated into an initial network (IntNet). Additional linkages from the genes’ network contexts (ContextNet) are then integrated to create the final network (FinalNet), with È34,000 linkages between 4681 genes (ConfidentNet) scoring higher than the gold standard (small-scale assays of protein interactions). Hierarchical clustering of ConfidentNet defined 627 modules of functionally linked genes spanning 3285 genes (‘‘ModularNet’’), approximating the set of cellular systems in yeast. Lee, ..., Marcotte, Science 306, 1555 (2004) Bioinformatics III
Scoring scheme for linkages Unified scoring scheme for linkages is based on a Bayesian statistics approach. Each experiment is evaluated for its ability to reconstruct known gene pathways and systems by measuring the likelihood that pairs of genes are functionally linked conditioned on the evidence, calculated as a log likelihood score: P(L|E) and P(L|E) : frequencies of linkages (L) observed in the given experiment (E) between annotated genes operating in the same pathway and in different pathways P(L) and P(L): the prior expectations (i.e., the total frequency of linkages between all annotated yeast genes operating in the same pathway and operating in different pathways). Scores > 0 indicate that the experiment tends to link genes in the same pathway, with higher scores indicating more confident linkages. Lee, ..., Marcotte, Science 306, 1555 (2004) Bioinformatics III
Benchmarks As scoring benchmarks, the method was tested against two primary annotation references: (1) the Kyoto-based KEGG pathway database and (2) the experimentally observed yeast protein subcellular locations determined by genome-wide green fluorescent protein (GFP)–tagging and microscopy. KEGG scores were used for integrating linkages, with the other benchmark withheld as an independent test of linkage accuracy. Cross-validated benchmarks and benchmarks based on the Gene Ontology (GO) and COG gene annotations provided comparable results. Lee, ..., Marcotte, Science 306, 1555 (2004) Bioinformatics III
Functional inference from interaction networks Benchmarked accuracy and extent of functional genomics data sets and the integrated networks. A critical point is the comparable performance of the networks on distinct benchmarks, which assess the tendencies for linked genes to share (A) KEGG pathway annotations or (B) protein subcellular locations. x axis: percentage of protein-encoding yeast genes provided with linkages by the plotted data; y axis: relative accuracy, measured as the of the linked genes’ annotations on that benchmark. The gold standards of accuracy (red star) for calibrating the benchmarks are smallscale protein-protein interaction data from DIP. Colored markers indicate experimental linkages; gray markers, computational. The initial integrated network (lower black line), trained using only the KEGG benchmark, has measurably higher accuracy than any individual data set on the subcellular localization benchmark; adding context-inferred linkages in the final network (upper black line) further improves the size and accuracy of the network. Lee, ..., Marcotte, Science 306, 1555 (2004) Bioinformatics III
Features of integrated networks At an intermediate degree of clustering that maximizes cluster size and functional coherence, 564 (of 627) modules are shown connected by the 950 strongest intermodule linkages. Module colors and shapes indicate associated functions, as defined by Munich Information Center for Protein Sequencing (MIPS), with sizes proportional to the number of genes, and connections inversely proportional to the fraction of genes linking the clusters. Lee, ..., Marcotte, Science 306, 1555 (2004) Bioinformatics III
Features of integrated networks Adding context-inferred linkages increased clustering of genes, which produced a highly modular gene network with well-defined subnetworks. We expected these gene clusters to reflect gene systems and modules. We could therefore generate a simplified view of the major trends in the network (Fig. 3B) by clustering genes of ConfidentNet according to their connectivities. Of the 4681 genes, 3285 (70.2%) were grouped into 627 clusters, reflecting the high degree of modularity. Genes‘ functions within each cluster are highly coherent, and with 2 to 154 genes per cluster (ca. 5 genes per cluster on average), the clusters effectively capture typical gene pathways and/or systems. Lee, ..., Marcotte, Science 306, 1555 (2004) Bioinformatics III
Features of integrated networks Portions of the final, confident gene network are shown for (C) DNA damage response and/or repair, where modularity gives rise to gene clusters, indicated by similar colors, and (D) chromatin remodeling, with several uncharacterized genes (red labels). Networks are visualized with Large Graph Layout (LGL). Lee, ..., Marcotte, Science 306, 1555 (2004) Bioinformatics III
Summary The probabilistic gene network integrates evidence from diverse sources to reconstruct an accurate network, by estimating the functional coupling among yeast genes, and provides a view of the relations between yeast proteins distinct from their physical interactions. The application of this strategy to other organisms, such as to the human genome, is conceptually straightforward: (i) assemble benchmarks for measuring the accuracy of linkages between human genes based on properties shared among genes in the same systems, (ii) assemble gold standard sets of highly accurate interactions for calibrating the benchmarks, and (iii) benchmark functional genomics data for their ability to correctly link human genes, then integrate the data as described. New data can be incorporated in a simple manner serving to reinforce the correct linkages. Thus, the gene network will ultimately converge by successive approximation to the correct structure simply by continued addition of functional genomics data in this framework. Lee, ..., Marcotte, Science 306, 1555 (2004) Bioinformatics III