Download
1 / 51
510 likes | 580 Vues
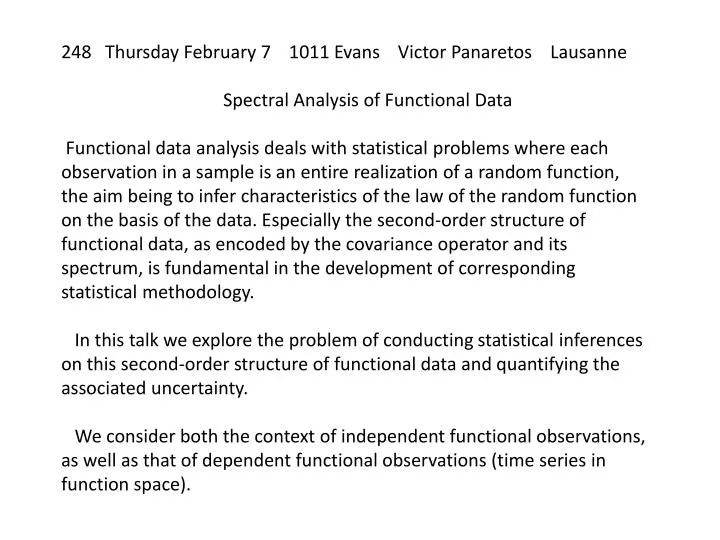
248 Thursday February 7 1011 Evans Victor Panaretos Lausanne Spectral Analysis of Functional Data

E N D
248 Thursday February 7 1011 Evans Victor Panaretos Lausanne Spectral Analysis of Functional Data Functional data analysis deals with statistical problems where each observation in a sample is an entire realization of a random function, the aim being to infer characteristics of the law of the random function on the basis of the data. Especially the second-order structure of functional data, as encoded by the covariance operator and its spectrum, is fundamental in the development of corresponding statistical methodology. In this talk we explore the problem of conducting statistical inferences on this second-order structure of functional data and quantifying the associated uncertainty. We consider both the context of independent functional observations, as well as that of dependent functional observations (time series in function space).
Elephant seal journey. Were endangered Formulas for: great circle, SDE
Aplysiacalifornica L10 as pacemaler
El Nino returns; will rain follow? SF Chronicle 9/7/2012 "El Nino/Southern Oscillation (ENSO) is the most important coupled ocean-atmospher phenomenon to cause global climate variability on interannual time scales."
http://www.esrl.noaa.gov/psd/enso/mei/table.html MEI Index (last update: 5 September 2012) Bimonthly MEI values (in 1/1000 of standard deviations), starting with Dec1949/Jan1950, thru last month. More information on the MEI can be found on the MEI homepage. Missing values are left blank. Note that values can still change with each monthly update, even though such changes are typically smaller than +/-0.1. All values are normalized for each bimonthly season so that the 44 values from 1950 to 1993 have an average of zero and a standard deviation of "1". Responses to 'FAQs' can be found below this table: YEAR DECJAN JANFEB FEBMAR MARAPR APRMAY MAYJUN JUNJUL JULAUG AUGSEP SEPOCT OCTNOV NOVDEC 1950 -1.022 -1.146 -1.289 -1.058 -1.42 -1.366 -1.33 -1.065 -.576 -.394 -1.154 -1.247 1951 -1.068 -1.196 -1.209 -.437 -.275 .464 .739 .853 .779 .752 .728 .467 1952 .406 .133 .088 .262 -.267 -.638 -.245 -.16 .362 .311 -.338 -.125 1953 .024 .38 .267 .712 .84 .246 .416 .253 .522 .092 .049 .313 1954 -.051 -.019 .175 -.506 -1.425 -1.589 -1.397 -1.468 -1.154 -1.372 -1.146 -1.106 1955 -.771 -.695 -1.133 -1.557 -1.631 -2.287 -1.932 -2.043 -1.826 -1.745 -1.826 -1.862 1956 -1.436 -1.3 -1.396 -1.156 -1.302 -1.508 -1.207 -1.143 -1.363 -1.463 -1.036 -1.014 1957 -.948 -.352 .152 .352 .908 .773 .937 1.122 1.183 1.098 1.133 1.231
10000 Hz Phrase: aaa…hhh Computer recognition of speech compare “signature” with members of library Pitch period
Pitch period 106-109 points Encode/decipher speech
Southern Oscillation Index ~ temperature El Nino - Central Pacific warms – every 3-7 years Recruitment – new fish period 12, 50 m driven by El Nino?
SOI period 1 year Recruit lags by 6 m negatively
Spatial data Periodicity along rows average across columns
Topics. t. s. {xj }, t=0,1,2,…} Probability model wn, ma, ar Time series = signal + noise acf, ccf (cov , corr) (, ) Strict/weak stationarity Gaussian X-bar Acf-hat, ccf-hat 2/(n)