Download
1 / 72
720 likes | 862 Vues
2004 Senior Management Briefing. 10 September, 2004. Strategy and growth overview. Andrew Lindberg. Managing Director. Financial objectives. Return on equity - Achieve 15% return on equity for the AWB Group in the medium term Solid EPS growth

E N D
2004 Senior Management Briefing 10 September, 2004
Strategy and growth overview Andrew Lindberg Managing Director
Financial objectives Return on equity - Achieve 15% return on equity for the AWB Group in the medium term Solid EPS growth - Landmark acquisition to be more than 35% EPS accretive (pre-goodwill, post synergies, post one-off costs) by 2005-06 Stable dividend payment - Expect to maintain dividend payment at current levels for 2004-05 Improve quality of earnings - Reduce exposure to crop by achieving more than 20% of PBT not related to Australian wheat by 2004-05
Some “Landmark” achievements • Network consolidation • Re-branding of all branches • Back office consolidation - relocation of critical staff to Melbourne • Recruitment of finance and insurance specialists • Incentive program implemented for all staff • AFS license and transfer of IBD arrangements with 85% retention rate • Phase 1 procurement completed with improved terms and conditions being obtained in all categories • SA pilot program - $2/tonne merchandise voucher • Launch of Fastrak Finance • At least 95% of the way through the integration stage, and 15% of the way through the growth stage
Most customers are comfortable with Landmark being an AWB company … Survey question: “Last year AWB took over the Landmark organisation to form Landmark – an AWB company. Generally speaking, how comfortable would you say you are with the two organisations now being joined?”
Leading position in Australian rural services People and Capability Leading rural financial services and insurance provider Australia’s leading global grain trading business Targets will be achieved by implementing three dominant business strategies AWB’s overarching goal is to implement anIntegrated Business Model...
Integrated Business Model will position AWB as Australia’s leading agribusiness
Three growth areas • Fertiliser and merchandise are the main areas targeted for growth • Cross selling • Leverage buying power in the network • Improve merchandise and supply chain effectiveness Leading position in Australian rural services • Increase product base – build on AWB’s natural advantage to provide a wider range of products, better interest rates, and streamline credit processes • Specific areas targeted for growth include lending, deposits, wealth management and general insurance Leading rural financial services and insurance provider • Continue to focus on mandate to maximise grower returns • Expand the suite of commodities, origins and risks managed • Strengthen the differentiated position for Australian wheat Australia’s leading global grain trading business
Outlook Australia’s agricultural outlook • Wheat crop: between 21 to 24 million tonnes for 2004-05 • Livestock • Cattle numbers forecast at 27.6 million head for 2004-05 • Sheep numbers forecast at 99.5 million head for 2004-05 • Wool: shorn wool production estimated to be 440 million kilograms greasy for 2003-04. Wool prices are heavily dependent on foreign exchange rates Integration of Landmark • On track to meet EBIT enhancement opportunities indicated at the announcement of the acquisition in August 2003 • Primarily cost synergies and finance growth at $5-$10m in 2003-04 increasing to $30-$40m by 2005-06
Rural Services Charles Stott GM – Rural Services
A period of change • 2003 • Growth phase • Nationalised structure • Merchandise sales recovery • East Coast fertiliser expansion • Drive wool and livestock growth and productivity • National finance and insurance expansion • 2004 • Integration and growth • Capture cost and revenue synergy benefits • Centralise head office function • Expansion of financial services and growth • Drive wool, livestock and merchandise growth and productivity • Network optimisation • Account management • 2001 & 2002 • Merger Dalgety & IAMA • Achievement synergies • Maintain revenue in existing businesses • Establish new brand identity • Capture merchandise and logistics opportunities OBJECTIVE 2004-05: Integrated Business Model
Merchandise • Merger of Wesfarmers Dalgety and IAMA in 2001 resulted in Landmark becoming Australia’s largest rural merchandise distributor • Stores across Australia stock a range of animal health, cropping, fencing, fertiliser and farm hardware product • Merchandise products are distributed via 230 company owned branches, 47 franchises and 120 members and agents, and supported by over 200 agronomists Australia wide
Merchandise overview … a generic strategy will be important
Fertiliser • Significant supplier of fertiliser distributing over 1 million tonnes per annum, as well as retailing liquid, trace element and specialist fertilisers • The major fertiliser products are globally traded commodities, resulting in: • Limited scope for differentiation between retail outlets; and • Importer traders ensuring world price movements rapidly flow through to domestic price (i.e. volatility)
Fertiliser overview … growing market share and volume is important
Livestock • One of Australia’s largest marketers of livestock • Operating in all States and Territories throughout Australia • Handles 20% of livestock trading in Australia • Core business is sale of livestock through saleyards - 70% sold via auction • Livestock trading is also a part of the business • Landmark supplies processors, supermarket processors, lot feeders and live export markets
Livestock overview … prices are expected to remain strong
Wool • Handle approximately 25% of the National Wool Clip (500,000 bales) • Provide traditional broking / auction selling services as well as a comprehensive range of Risk Management products • 50% interest in Australian Wool Handlers ‘AWH’ (with Elders) –wool handling • Not involved in any downstream processing
Wool overview … increased throughput is the key
Landmark real estate has two main activities: Real Estate - Rural property sales - Residential property sales
Real Estate overview … good platform to grow residential market share
Integration of Landmark June 30 2004 September 30 2004 Day 1 – August 29 2003 Completion and Signing Transaction Integration Project Management Network, IT and HR Integration are on going Integration Planning Transition Integration Integration Full completion/transition has now occurred of all Landmark accounting, finance, treasury, business development, HR, risk, corporate insurance, IT, marketing services, stakeholder relations and legal functions within AWB functions Growth Extending and creating value and building the Integrated Business Model Synergy Benefits
Outlook • Opportunities exist to grow in most activities • Commodity prices expected to remain strong • Real Estate values expected to plateau
Network Operations John Maher GM – Network Operations
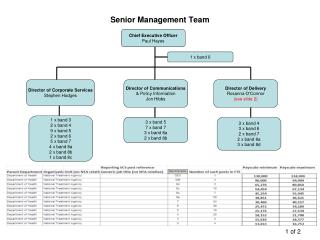
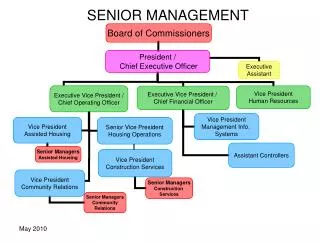
19 Network structure and rural footprint Staff = 363 46 1 Staff = 293 Branches Staff = 239 29 35 47 43 11 19 Franchises / Agents Staff = 350 14 28 37 Members Staff = 455 31 57 8
Network operations will focus on • Account Management • Network Optimisation • Integrated Business Model as well as……. • Training & Development • Profitability Improvements (financial services & merchandise / fertiliser) • Operational Excellence
Account management – cross sell opportunities The number of activities utilised by each customer of Landmark is low Activity – Key Customers Penetration across other activities (%) High cross sell growth opportunities
Account management – customer relationship management (at branch level) • Utilising data to segment Landmark & AWB’s customer base • Developing appropriate service level protocols & disciplines • Improving differentiation in service levels
Key strategies for account management • Institutionalise the customer knowledge historically maintained with individual employees. • Evolve the culture from an activity specialisation focus to a customer relationship focus, and build an account management philosophy. • Increase “share of wallet” from our existing customer bases.
Network optimisation (continued) Improve profitability, capture growth and improve return on capital Optimise current branch /franchise options Optimise network footprint Optimise network format • Branch categorisation • Identification and analysis of growth opportunities • Outlet design and standards
Identified opportunities within each geographic segment and branch catchment area Corporate Branch Market Share vs Market Size Average size Profit contribution by outlet is variable due to a number of factors Market Share Market Potential
Network configuration • Three distinct channels to market • Leveraged properly, provides a competitive advantage Branch Franchise Member Channel partner’s inflation adjusted growth rate Principal’s share of channel partner’s product category sales Size of circle indicates value of channel partner’s revenue
What will the network look like in 3 years? • Strategies in place to optimise our foot-print and maximise profit pool opportunities • High potential business managers matched to high potential locations • Optimal store configurations • Optimal catchment areas • Efficient channels to market
Update on IFRS Paul Ingleby Chief Financial Officer
Update on IFRS • Background • Progress to date • Project timeline • First time adoption • What’s next
IFRS background • In July 2002, the AASB committed to full adoption of International Standards • Global capital requires consistent reporting • Consistency with Europe, fewer differences from US GAAP • Applies for financial years on or after 1 January 2005 • First applies to AWB for the half year ended 31 March 2006 including comparatives • Impact disclosure is qualitative at 30 September 2004, and quantitative at 30 September 2005 • AWB project kicked off January 2004 and Deloitte was enlisted as an expert consulting partner
Progress to end of August • Major impacts identified • No impact on pool reporting • Impediments to hedge classification • Goodwill impairment testing • Performance rights and share plans to P&L • Balance sheet method for deferred tax • Documentation of first time adoption position • Realistic project timelines with resources identified and committed • Board and audit committee regularly briefed
Project timeline Sept 05 Sept 06 Mar 05 Mar 06 Sep 04 3 4 5 1 2 • March 06 • Half year IFRS compliant report • Sept 06 • First full year IFRS compliant annual report • March 05 • Half year comparatives • Exclusion of AASB 132 &139 • Inventory of instruments • Accounting for trading transactions • Valuation methodology • Sept 05 • Full year comparatives excluding AASB 132 &139 • Transition entries identified for AASB 132 &139 • Full policies to include AASB 132 &139 • Systems in place for all IAS requirements including AASB 132 &139, where applicable: hedge, designations, effectiveness and testing • AASB 1047 quantitative impact analysis • Sept 04 • Comparative opening balance sheet • Exclusion of AASB 132 &139 • ASIC disclosure AASB 1047 qualitative impact analysis • Systems implementation strategy
AWB’s first time adoption • Maintain Landmark acquisition accounts • No financial instruments comparatives • Retain Foreign Currency Translation Reserve • No revaluation of fixed assets
What’s next for IFRS • Draft opening balance sheet • Implement comparative data capture • 2005 financial year • Non financial instruments only • Leverage tax consolidations software and Market Risk Control Framework • Implement financial instruments detailed hedge assessment
Wheat prices, futures and global supply Sarah Scales GM, AWB (International) Limited
World wheat production • World wheat production has increased 56 million tonnes to 608 million tonnes in 2004 • Significant production increases occurred in the • EU-25 106 mmt to 129 mmt • FSU 61 mmt to 84 mmt • India 65 mmt to 72 mmt • China 86 mmt to 90 mmt • US crop declined from 64 mmt to 58 mmt
World wheat production & consumption Source: USDA 2004
World wheat trade – 5% major exporters * 2003/04 & 2004/05 – estimated Source: USDA
World stocks • A larger world production was required as world stocks remain historically low • From 202 mmt in 2002-03 to 167 million tonnes in 2003-04 to 132 million tonnes in 2004-05 and 142 million tonnes 2005 • Other major world crops are showing the same trend • Corn from 148 million tonnes in 2002-03 to 85 million tonnes in 2004-05 • Rice from 139 million tonnes in 2002-03 to 68 million tonnes in 2004-05 • This prevents a huge production swing into one crop • Human consumption demand increasing at long term trend of 1% • Feed demand will increase 7 million tonnes due to larger feed wheat availability in 2004-05
Prices • Production risk premium has been removed from the market and this has seen Kansas futures decline from in excess of US$4 bushel to US$3.40 bushel • APW National Pool return has declined from $220 FOB to $197 FOB for 2004/05 pool • Weaker currency is supportive to price
The future • Increased production and export supply from the Russia and Ukraine likely over time • Exports from the Black Sea work initially into the Mediterranean, then Africa and the Middle East • This is one of the major drivers for AWB to focus on increasing exports into Asian markets over the next five years • AWB exports into Asia in 2004 will be greater than 10 million tonnes for the first time
Outlook • Risk premium has been taken out of current prices • Strong competition from Northern Hemisphere export origins in the short term • There is still a tight balance sheet that will react to any production issue in 2005 • China expected to continue strong import program in 2005 • AWB confident of retaining 50% of Iraq import demand
Financial Services Marcus Kennedy GM – Financial Services