1 / 13

HW: Pg. 166-167 #10-14, 15-21o

HW: Pg. 166-167 #10-14, 15-21o. Min of -34 at (-2, -6); Max of 27 at (1, 5) Min of 10 at (2, 1); No Max – feasible region is unbounded Min of 0 at (0, 0); Max of 27 at (0, 9) Min of 6 at (2, 1); Max of 29 at (5, 6) Min of -12 at (-5, -2); Max of 2 at (0, 2)

nen
Télécharger la présentation

HW: Pg. 166-167 #10-14, 15-21o

An Image/Link below is provided (as is) to download presentation Download Policy: Content on the Website is provided to you AS IS for your information and personal use and may not be sold / licensed / shared on other websites without getting consent from its author. Content is provided to you AS IS for your information and personal use only. Download presentation by click this link. While downloading, if for some reason you are not able to download a presentation, the publisher may have deleted the file from their server. During download, if you can't get a presentation, the file might be deleted by the publisher.

E N D

Presentation Transcript


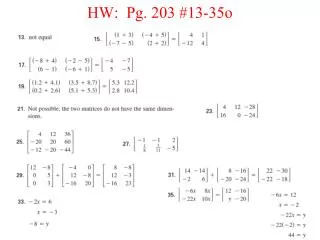
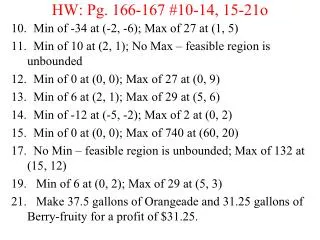
  1. HW: Pg. 166-167 #10-14, 15-21o Min of -34 at (-2, -6); Max of 27 at (1, 5) Min of 10 at (2, 1); No Max – feasible region is unbounded Min of 0 at (0, 0); Max of 27 at (0, 9) Min of 6 at (2, 1); Max of 29 at (5, 6) Min of -12 at (-5, -2); Max of 2 at (0, 2) Min of 0 at (0, 0); Max of 740 at (60, 20) No Min – feasible region is unbounded; Max of 132 at (15, 12) 19. Min of 6 at (0, 2); Max of 29 at (5, 3) 21. Make 37.5 gallons of Orangeade and 31.25 gallons of Berry-fruity for a profit of $31.25.

  2. X, Y, Z Coordinates (2, 3, 4) Graph like you are giving directions !

  3. 3.5 Graphing Linear Equations in Three Variables

  4. 3.5 Graphing Linear Equations in Three Variables

  5. 3.5 Graphing Linear Equations in Three Variables

  6. 3.5 Graphing Linear Equations in Three Variables

  7. Homework: Pg. 173-174 #19-25o, 27-35eoo, 39-45o

More Related