Download
1 / 1
10 likes | 140 Vues
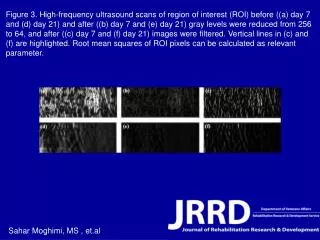
This study uses high-frequency ultrasound scans to analyze the region of interest (ROI) over time. The scans were conducted on days 7 and 21, revealing significant reductions in gray levels from 256 to 64. Images were further filtered, with vertical lines highlighted for emphasis. The root mean squares of ROI pixels serve as a key parameter for evaluating changes. The findings indicate the potential for these ultrasound techniques in monitoring specific regions over various time frames, as demonstrated by Sahar Moghimi and colleagues.

E N D
Figure 3. High-frequency ultrasound scans of region of interest (ROI) before ((a) day 7 and (d) day 21) and after ((b) day 7 and (e) day 21) gray levels were reduced from 256 to 64, and after ((c) day 7 and (f) day 21) images were filtered. Vertical lines in (c) and (f) are highlighted. Root mean squares of ROI pixels can be calculated as relevant parameter. Sahar Moghimi, MS , et.al